我希望有人能告诉我,使用FLOT Javascript库是否可以实现我正在尝试做的事情。我想显示一个具有双轴和三个数据集的图表(如下所示)。一个数据集在左轴上,两个数据集在右轴上。我真正想做的是将右轴上的两个数据集堆叠起来,因为它们应该显示累积值。到目前为止,我无法使此图表响应设置“stack: true”选项。
如果有人能帮我解决这个问题,我会非常感激。这是我的代码和当前图表的快照。我正在尝试堆叠蓝色和绿色区域,它们对应右轴(y2)。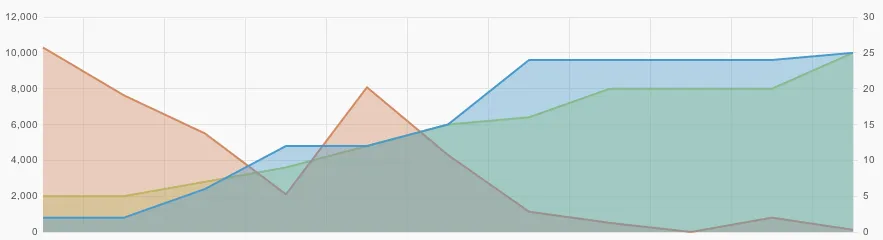
如果有人能帮我解决这个问题,我会非常感激。这是我的代码和当前图表的快照。我正在尝试堆叠蓝色和绿色区域,它们对应右轴(y2)。
$(function () {
var previousPoint;

var completes = [[1346954400000, 5], [1346997600000, 5], [1347040800000, 7], [1347084000000, 9], [1347127200000, 12], [1347170400000, 15], [1347213600000, 16], [1347256800000, 20], [1347300000000, 20], [1347343200000, 20], [1347386400000, 25]];
var holds = [[1346954400000, 2], [1346997600000, 2], [1347040800000, 6], [1347084000000, 12], [1347127200000, 12], [1347170400000, 15], [1347213600000, 24], [1347256800000, 24], [1347300000000, 24], [1347343200000, 24], [1347386400000, 25]];
var screeners = [[1346954400000, 10298], [1346997600000, 7624], [1347040800000, 5499], [1347084000000, 2100], [1347127200000, 8075], [1347170400000, 4298], [1347213600000, 1134], [1347256800000, 507], [1347300000000, 0], [1347343200000, 800], [1347386400000, 120]];


var ds = new Array();

ds.push({
    data:completes,
    label: "Complete",
    yaxis: 2,
    lines: {
        show: true,
        fill: true,
        order: 2,
    }
});
ds.push({
    data:screeners,
    label: "Pre-Screened",
    yaxis: 1,
    lines: {
        show: true,
        fill: true,
        order: 1,
    }
});
ds.push({
    data:holds,
    label: "Holds",
    yaxis: 2,
    lines: {
        show: true,
        fill: true,
        order: 3,
    }
});

//tooltip function
function showTooltip(x, y, contents, areAbsoluteXY) {
    var rootElt = 'body';

    $('<div id="tooltip2" class="tooltip">' + contents + '</div>').css( {
        position: 'absolute',
        display: 'none',
        top: y - 35,
        left: x - 5,
        border: '1px solid #000',
        padding: '1px 5px',
        'z-index': '9999',
        'background-color': '#202020',
        'color': '#fff',
        'font-size': '11px',
        opacity: 0.8
    }).prependTo(rootElt).show();
}

//Display graph
$.plot($("#placeholder1"), ds, {
    grid:{
        hoverable:true
    },
    xaxes: [ { mode: 'time', twelveHourClock: true, timeformat: "%m/%d %H:%M" } ],
    yaxes: [ {  min: 0,
                tickFormatter: function numberWithCommas(x)
                {
                    return x.toString().replace(/\B(?=(?:\d{3})+(?!\d))/g, ",");
                },
             }
            ],
    y2axis: [ ],
    legend: { show: true }
});
});