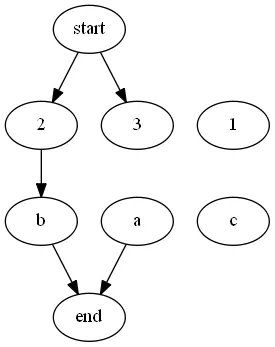
我正在使用SPYDER。我有以下代码。该代码生成图表。但是图表不够清晰。我想在图表中看到层次结构-我的第一层有“start”节点,第二层有1、2、3节点,第三层有“a”、“b”、“c”节点,最后一层有“end”节点。有什么办法可以实现我的目标吗?
import networkx as nx
import matplotlib.pyplot as plt
import os.path as path

G=nx.DiGraph()
G.add_nodes_from(['start',1,2,3,'a','b','c','end'])

G.nodes(data=True)

G.add_edge('start',2)
G.add_edge('start',3)
G.add_edge(2,'b')
G.add_edge('b','end')
G.add_edge('a','end')
G.add_edge('f','g')
nx.draw(G)
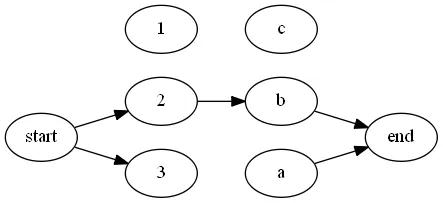
我理解为“分层”是指像附图所示的网络结构。我想要以这种方式绘制网络,因为层X中的节点仅与层X + 1或层X-1中的节点直接连接。