我正在用Python实现来自GeeksForGeeks的Bellman-Ford算法。我想使用像pyplot或networkx之类的库来生成图形(图表形式而不是字典类型-这很容易)。我希望图形界面包含节点、边和相应的成本。
from collections import defaultdict
#Class to represent a graph
class Graph:
def __init__(self,vertices):
self.V= vertices #No. of vertices
self.graph = [] # default dictionary to store graph
# function to add an edge to graph
def addEdge(self,u,v,w):
self.graph.append([u, v, w])
# utility function used to print the solution
def printArr(self, dist):
print("Vertex Distance from Source")
for i in range(self.V):
print("%d \t\t %d" % (i, dist[i]))
# The main function that finds shortest distances from src to
# all other vertices using Bellman-Ford algorithm. The function
# also detects negative weight cycle
def BellmanFord(self, src):
# Step 1: Initialize distances from src to all other vertices
# as INFINITE
dist = [float("Inf")] * self.V
dist[src] = 0
# Step 2: Relax all edges |V| - 1 times. A simple shortest
# path from src to any other vertex can have at-most |V| - 1
# edges
for i in range(self.V - 1):
# Update dist value and parent index of the adjacent vertices of
# the picked vertex. Consider only those vertices which are still in
# queue
for u, v, w in self.graph:
if dist[u] != float("Inf") and dist[u] + w < dist[v]:
dist[v] = dist[u] + w
# Step 3: check for negative-weight cycles. The above step
# guarantees shortest distances if graph doesn't contain
# negative weight cycle. If we get a shorter path, then there
# is a cycle.
for u, v, w in self.graph:
if dist[u] != float("Inf") and dist[u] + w < dist[v]:
print "Graph contains negative weight cycle"
return
# print all distance
self.printArr(dist)
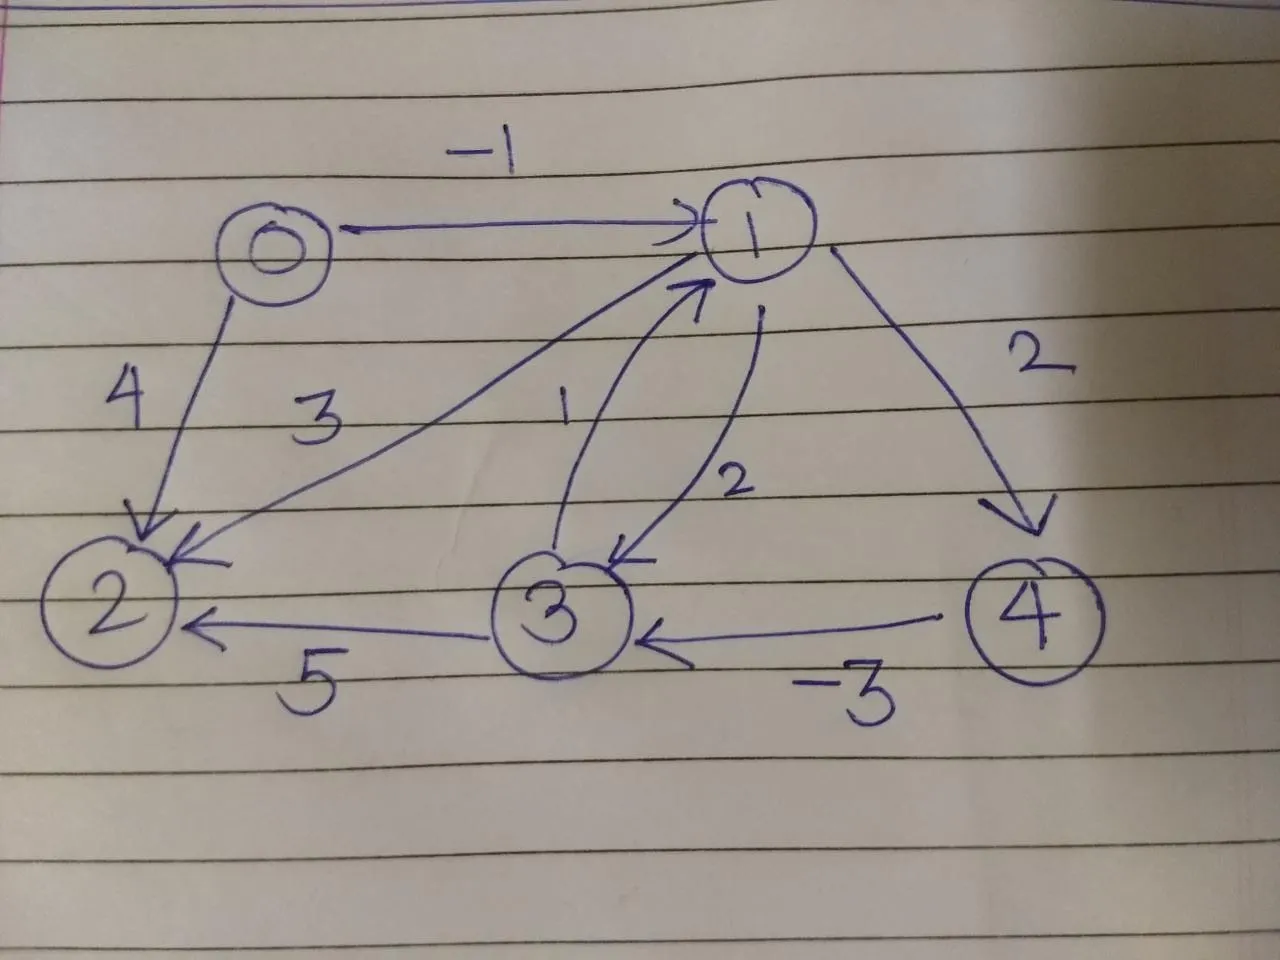
g = Graph(5)
g.addEdge(0, 1, -1)
g.addEdge(0, 2, 4)
g.addEdge(1, 2, 3)
g.addEdge(1, 3, 2)
g.addEdge(1, 4, 2)
g.addEdge(3, 2, 5)
g.addEdge(3, 1, 1)
g.addEdge(4, 3, -3)
我需要的图表(基于上述代码)可以在终端或单独的文件中显示:
networkx非常适合这个应用场景。 - ImportanceOfBeingErnest