为复杂的图表构建手动图例

91

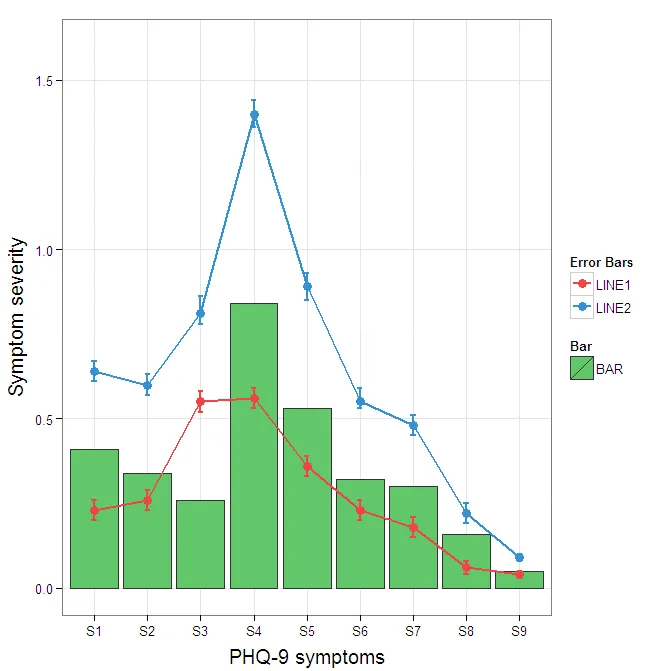
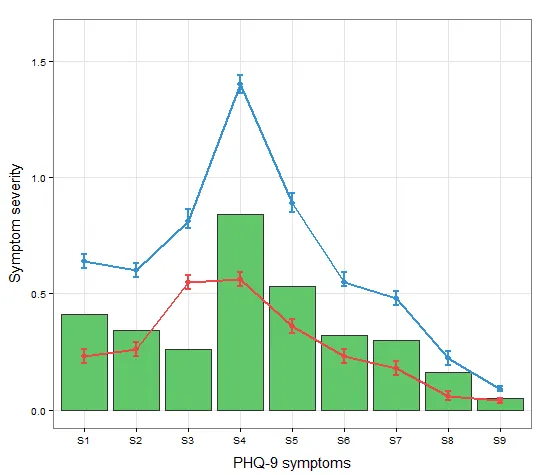
我不知道如何手动设置这个图的图例。我只想要一个简单的图例放在右边,使用三种颜色并且每个颜色旁边都有一个名称。

enter image description here

当前的代码看起来像这样:

a <-c("S1","S2","S3","S4","S5","S6","S7","S8","S9") #names
b <-c(0.23,0.26,0.55,0.56,0.36,0.23,0.18,0.06,0.04) #mean t0
c <-c(0.64,0.6,0.81,1.4,0.89,0.55,0.48,0.22,0.09) #mean t1
d <-c(0.20,0.23,0.52,0.53,0.33,0.20,0.15,0.04,0.03) #SD low t0
e <-c(0.26,0.29,0.58,.59,0.39,0.26,0.21,0.08,0.05) #SD high t0
f <-c(0.67,0.63,0.86,1.44,0.93,0.59,0.51,0.25,0.10) #SD high t1
g <-c(0.61,0.57,0.78,1.36,0.85,0.53,0.45,0.19,0.08) #SD low t1
h <-c(0.41,0.34,0.26,0.84,0.53,0.32,0.30,0.16,0.05) #absolute change

data <- data.frame(a,b,c,d,e,f,g,h)

ggplot(data=data,aes(a)) + 
  geom_bar(stat="identity", aes(y=h),fill="#62c76b",colour="#333333")+ #green
  geom_line(aes(y=b,group=1),size=1.0,colour="#f04546") +   #red
  geom_point(aes(y=b),size=3, colour="#f04546") +           #red
  geom_errorbar(aes(ymin=d, ymax=e), colour="#f04546", width=0.1, size=.8) + 
  geom_line(aes(y=c,group=1),size=1.0,colour="#3591d1") +   #blue 
  geom_point(aes(y=c),size=3, colour="#3591d1") +           #blue
  geom_errorbar(aes(ymin=f, ymax=g), colour="#3591d1", width=0.1, size=.8) + 
  ylab("Symptom severity") + xlab("PHQ-9 symptoms") +
  ylim(0,1.6) +
  theme_bw() +
  theme(axis.title.x = element_text(size = 15, vjust=-.2)) +
  theme(axis.title.y = element_text(size = 15, vjust=0.3))
4
非常有帮助 - 如果没有文档和教程,我从哪里获得代码呢? - Torvon
2个回答

129
你需要将属性映射到美学(aes语句中的颜色)以生成图例。
cols <- c("LINE1"="#f04546","LINE2"="#3591d1","BAR"="#62c76b")
ggplot(data=data,aes(x=a)) + 
  geom_bar(stat="identity", aes(y=h, fill = "BAR"),colour="#333333")+ #green
  geom_line(aes(y=b,group=1, colour="LINE1"),size=1.0) +   #red
  geom_point(aes(y=b, colour="LINE1"),size=3) +           #red
  geom_errorbar(aes(ymin=d, ymax=e, colour="LINE1"), width=0.1, size=.8) + 
  geom_line(aes(y=c,group=1,colour="LINE2"),size=1.0) +   #blue 
  geom_point(aes(y=c,colour="LINE2"),size=3) +           #blue
  geom_errorbar(aes(ymin=f, ymax=g,colour="LINE2"), width=0.1, size=.8) + 
  scale_colour_manual(name="Error Bars",values=cols) + scale_fill_manual(name="Bar",values=cols) +
  ylab("Symptom severity") + xlab("PHQ-9 symptoms") +
  ylim(0,1.6) +
  theme_bw() +
  theme(axis.title.x = element_text(size = 15, vjust=-.2)) +
  theme(axis.title.y = element_text(size = 15, vjust=0.3))
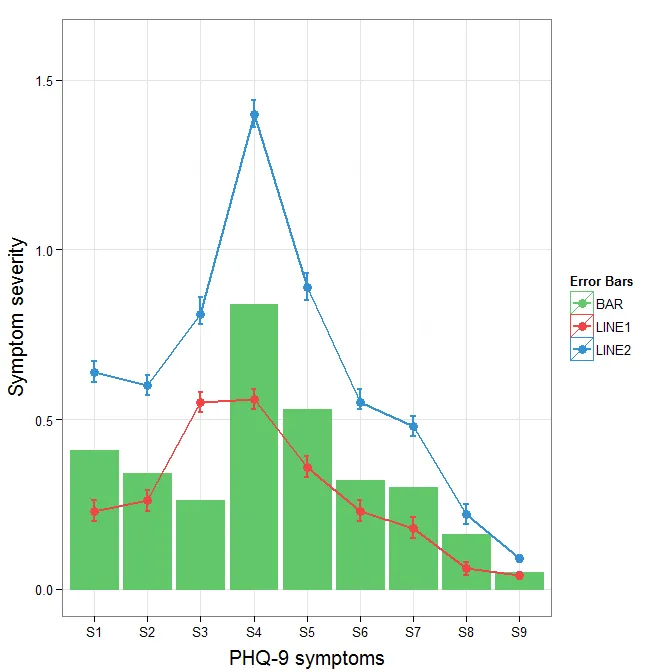
在此输入图片描述

我理解Roland的观点,但由于只涉及3个属性,并且叠加条形图和误差线会引起复杂性问题,因此保留数据的宽格式可能是合理的。您可以使用geom_pointrange来稍微减少复杂度。


如果要更改原始数据中误差线图例的背景颜色,请在绘图规范中添加+ theme(legend.key = element_rect(fill = "white",colour = "white"))。通常需要对所有元素进行一致的映射才能合并不同的图例,但当前在我的情况下会产生黑色背景的瑕疵。我认为guide = guide_legend(fill = NULL,colour = NULL) 可以将图例的背景设为空值,但实际上却没有成功。也许这值得再提一个问题。

ggplot(data=data,aes(x=a)) + 
  geom_bar(stat="identity", aes(y=h,fill = "BAR", colour="BAR"))+ #green
  geom_line(aes(y=b,group=1, colour="LINE1"),size=1.0) +   #red
  geom_point(aes(y=b, colour="LINE1", fill="LINE1"),size=3) +           #red
  geom_errorbar(aes(ymin=d, ymax=e, colour="LINE1"), width=0.1, size=.8) + 
  geom_line(aes(y=c,group=1,colour="LINE2"),size=1.0) +   #blue 
  geom_point(aes(y=c,colour="LINE2", fill="LINE2"),size=3) +           #blue
  geom_errorbar(aes(ymin=f, ymax=g,colour="LINE2"), width=0.1, size=.8) + 
  scale_colour_manual(name="Error Bars",values=cols, guide = guide_legend(fill = NULL,colour = NULL)) + 
  scale_fill_manual(name="Bar",values=cols, guide="none") +
  ylab("Symptom severity") + xlab("PHQ-9 symptoms") +
  ylim(0,1.6) +
  theme_bw() +
  theme(axis.title.x = element_text(size = 15, vjust=-.2)) +
  theme(axis.title.y = element_text(size = 15, vjust=0.3))
要消除图例中的黑色背景,需要使用guide_legendoverride.aes参数。这样可以让您指定图例的特定方面,以确保其正确性。

ggplot(data=data,aes(x=a)) + 
  geom_bar(stat="identity", aes(y=h,fill = "BAR", colour="BAR"))+ #green
  geom_line(aes(y=b,group=1, colour="LINE1"),size=1.0) +   #red
  geom_point(aes(y=b, colour="LINE1", fill="LINE1"),size=3) +           #red
  geom_errorbar(aes(ymin=d, ymax=e, colour="LINE1"), width=0.1, size=.8) + 
  geom_line(aes(y=c,group=1,colour="LINE2"),size=1.0) +   #blue 
  geom_point(aes(y=c,colour="LINE2", fill="LINE2"),size=3) +           #blue
  geom_errorbar(aes(ymin=f, ymax=g,colour="LINE2"), width=0.1, size=.8) + 
  scale_colour_manual(name="Error Bars",values=cols, 
                      guide = guide_legend(override.aes=aes(fill=NA))) + 
  scale_fill_manual(name="Bar",values=cols, guide="none") +
  ylab("Symptom severity") + xlab("PHQ-9 symptoms") +
  ylim(0,1.6) +
  theme_bw() +
  theme(axis.title.x = element_text(size = 15, vjust=-.2)) +
  theme(axis.title.y = element_text(size = 15, vjust=0.3))

在此输入图像描述


Andy,非常感谢。 (1) 有没有一种方法可以将2行与1个图例“合并”? (2) 是否有一种手动更改图例的方法?例如,LINE1和LINE2周围灰色边框的颜色?我在ggplot2文档中没有找到任何信息(我的所有代码都来自该文档)。 - Torvon
@Torvon,要合并图例,通常需要为每个几何对象提供一致的映射。我会用一个示例进行更新,但这可能会产生奇怪的效果(也许是因为线条没有内部填充)。如果您希望对其进行修改,可能值得再提一个问题。我认为使用两个图例非常简单,所以我不认为使用不同的图例是一个好主意。 - Andy W
这真的非常有帮助,但我遇到的唯一问题是我的图例与您的第一个示例(误差线、线1、线2、柱形图、柱形图)不同,而是显示为“误差线、柱形图、线1、线2、柱形图”……您有什么想法可以通过scale_color_manual传递哪些参数来进行调整吗? - dre
创建一个可复现的示例并向 @dre 发起一个新问题可能是值得的。没有这个可复现的示例,帮助起来确实很困难。 - Andy W

14

如果你在更改linetypes方面有困难,以下答案应该会有所帮助。(这是对Andy W解决方案的补充。)

我们将尝试扩展已学习的模式:

cols <- c("LINE1"="#f04546","LINE2"="#3591d1","BAR"="#62c76b")
line_types <- c("LINE1"=1,"LINE2"=3)
ggplot(data=data,aes(x=a)) + 
  geom_bar(stat="identity", aes(y=h,fill = "BAR"))+ #green
  geom_line(aes(y=b,group=1, colour="LINE1", linetype="LINE1"),size=0.5) +   #red
  geom_point(aes(y=b, colour="LINE1", fill="LINE1"),size=2) +           #red
  geom_line(aes(y=c,group=1,colour="LINE2", linetype="LINE2"),size=0.5) +   #blue 
  geom_point(aes(y=c,colour="LINE2", fill="LINE2"),size=2) +           #blue
  scale_colour_manual(name="Error Bars",values=cols, 
                  guide = guide_legend(override.aes=aes(fill=NA))) + 
  scale_linetype_manual(values=line_types)+
  scale_fill_manual(name="Bar",values=cols, guide="none") +
  ylab("Symptom severity") + xlab("PHQ-9 symptoms") +
  ylim(0,1.6) +
  theme_bw() +
  theme(axis.title.x = element_text(size = 15, vjust=-.2)) +
  theme(axis.title.y = element_text(size = 15, vjust=0.3))

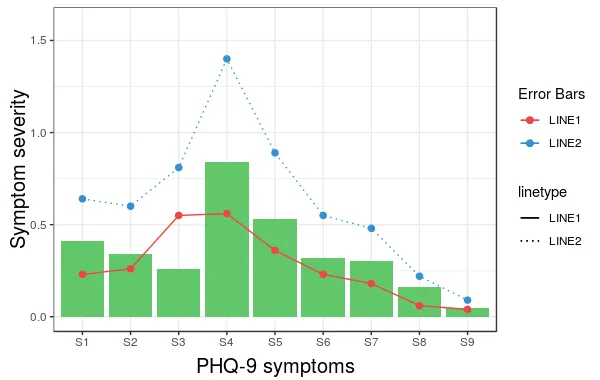
然而,我们得到的结果如下: manual without name

问题在于linetype没有合并到主图例中。 请注意,我们没有给方法scale_linetype_manual命名。 解决这个问题的方法是给它一个与scale_color_manual相同的名称。 具体来说,如果我们将相应的行更改为以下内容,就可以得到所需的结果:

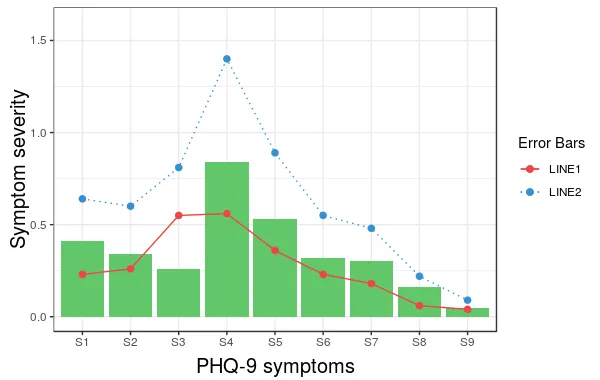
scale_linetype_manual(name="Error Bars",values=line_types)

具有相同名称的手册

现在,使用相同的想法很容易改变线条的大小。

请注意,geom_bar 不再具有颜色属性。(我没有尝试修复这个问题。)此外,添加带有 color 属性的 geom_errorbar 会破坏结果。如果有人能提出一个更好的解决方案来解决这两个问题,那就太好了。


不幸的是,合并两个图例的技巧似乎不再起作用了。在‘ggplot2’ v3.3.5中,这只会产生两个具有相同标题的图例。 - Konrad Rudolph

网页内容由stack overflow 提供, 点击上面的
可以查看英文原文,
原文链接