我希望能够控制Python 3.5中seaborn绘图的轴刻度数量。我非常习惯于使用R语言的ggplot,因此在Python中找到类似的功能有些困难。
以下是我目前使用的数据示例:
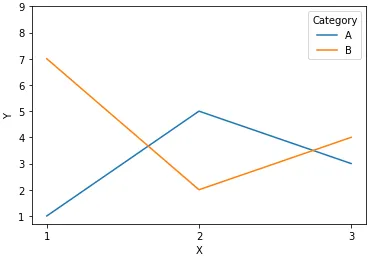
test = pd.DataFrame()
test["X"] = [1,2,3,1,2,3]
test["Y"] = [1,5,3,7,2,4]
test["Category"] = ["A", "A", "A", "B", "B", "B"]
我想要做类似于ggplot的facet_wrap()的事情,可以通过以下方式实现:
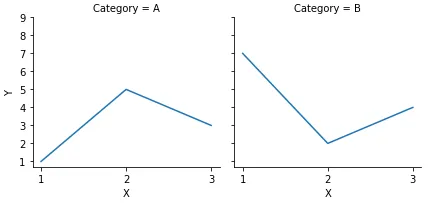
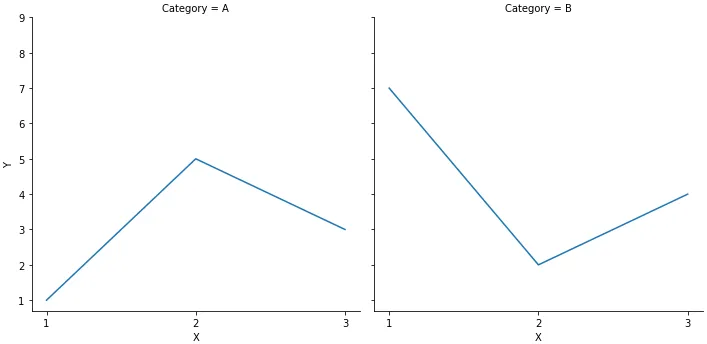
sns.set(style = "ticks", color_codes = True)
test_plot = sns.FacetGrid(test, col = "Category")
test_plot = (test_plot.map(sns.plt.plot, "X", "Y").add_legend())
test_plot.set_xticks(np.arange(1,4,1))
sns.plt.show(test_plot)
然而,我遇到了以下错误。问题似乎与在FacetGrid中设置轴标签有关,但我不知道该如何解决。这是Python 3的问题还是在面板绘图上指定轴的问题?
UserWarning: tight_layout : falling back to Agg renderer
警告:tight_layout :回退到Agg渲染器
test_plot.set_xticks(np.arange(1,4,1))
AttributeError: 'FacetGrid' object has no attribute 'set_xticks'