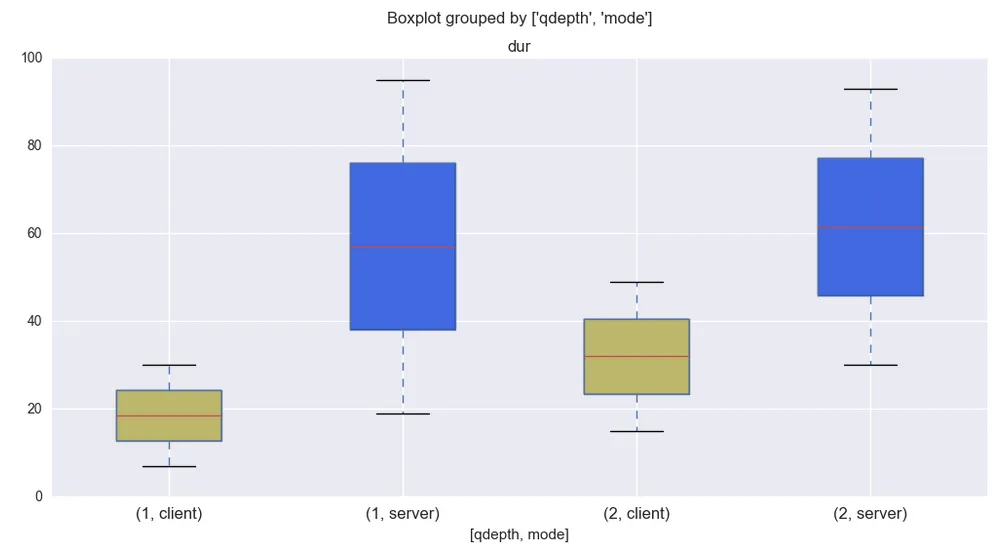
我有一个Pandas数据框,我想创建一个按qdepth组织的“dur”值的箱形图,其中包括两个变量client和server(qdepth在x轴上,duration在y轴上)。看起来我需要将client和server作为列。尝试使用unstack和reset_index的组合仍然无法解决问题。请参考以下示例图片: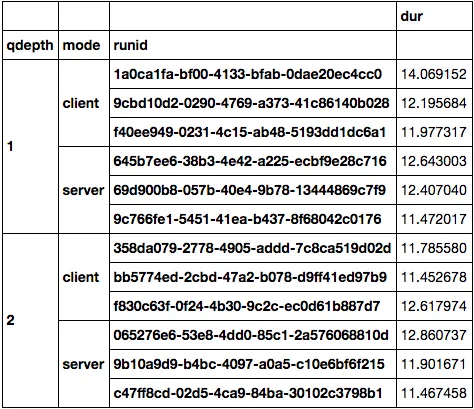
由于您只提供了一张图片而没有发布数据,因此我重新创建了一些虚拟数据:
qdepth,mode,runid,dur
1,client,0x1b7bd6ef955979b6e4c109b47690c862,7.0
1,client,0x45654ba030787e511a7f0f0be2db21d1,30.0
1,server,0xb760550f302d824630f930e3487b4444,19.0
1,server,0x7a044242aec034c44e01f1f339610916,95.0
2,client,0x51c88822b28dfa006bf38603d74f9911,15.0
2,client,0xd5a9028fddf9a400fd8513edbdc58de0,49.0
2,server,0x3943710e587e3932adda1cad8eaf2aeb,30.0
2,server,0xd67650fd984a48f2070de426e0a942b0,93.0
加载数据:df = pd.read_clipboard(sep=',', index_col=[0,1,2])
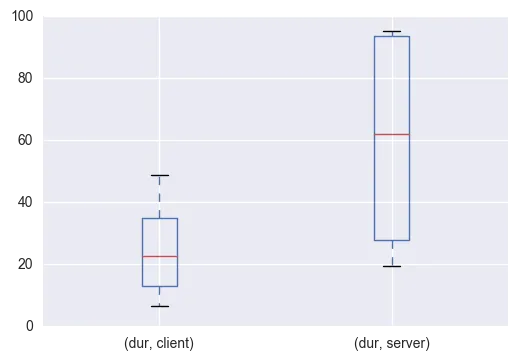
选项 1:
df.unstack(level=1).boxplot()
选项2:
df.unstack(level=[0,1]).boxplot()
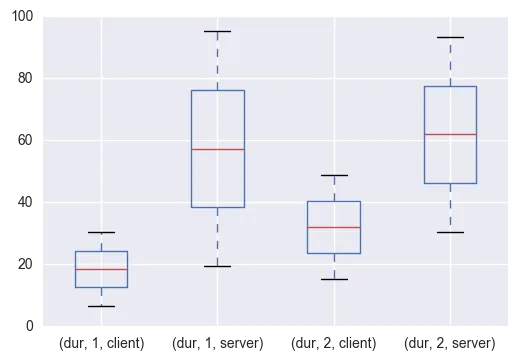
选项 3:
使用 seaborn:
import seaborn as sns
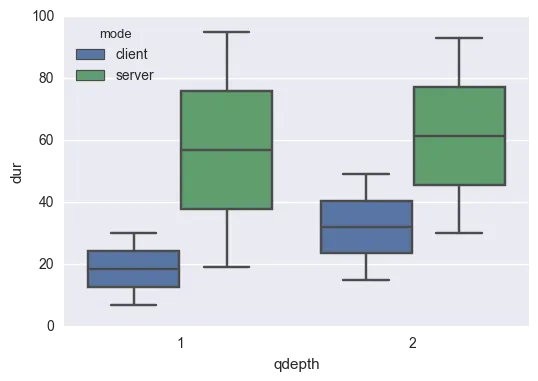
sns.boxplot(x="qdepth", hue="mode", y="dur", data=df.reset_index(),)
更新:
为了回答您的评论,这里提供了一种使用 pandas 和 matplotlib 重新创建 seaborn 选项的非常近似的方法(可用作起点):
fig, ax = plt.subplots(nrows=1,ncols=1, figsize=(12,6))
#bp = df.unstack(level=[0,1])['dur'].boxplot(ax=ax, return_type='dict')

bp = df.reset_index().boxplot(column='dur',by=['qdepth','mode'], ax=ax, return_type='dict')['dur']

# Now fill the boxes with desired colors
boxColors = ['darkkhaki', 'royalblue']
numBoxes = len(bp['boxes'])
for i in range(numBoxes):
    box = bp['boxes'][i]
    boxX = []
    boxY = []
    for j in range(5):
        boxX.append(box.get_xdata()[j])
        boxY.append(box.get_ydata()[j])
    boxCoords = list(zip(boxX, boxY))
    # Alternate between Dark Khaki and Royal Blue
    k = i % 2
    boxPolygon = mpl.patches.Polygon(boxCoords, facecolor=boxColors[k])
    ax.add_patch(boxPolygon)

plt.show()