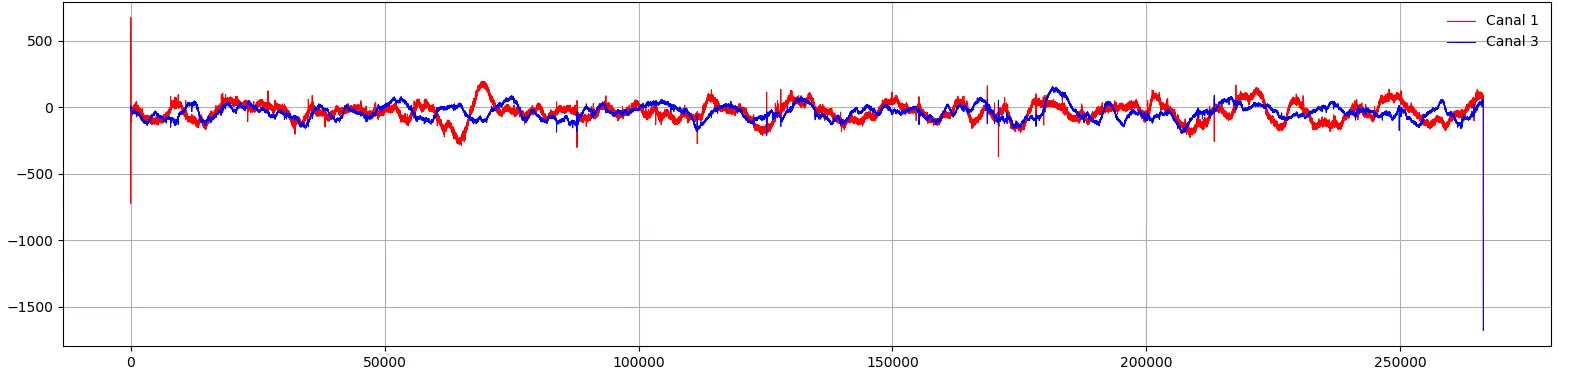
我有一段代码可以创建这个图形,但我不知道如何删除“通道1” - 红线的第一个数据和“通道3” - 蓝线的最后一个数据,即那些垂直线。这两个通道中都有266336个记录,你能帮忙吗?
红色垂直线是第一条记录,蓝色垂直线是最后一条记录。
import iodata as io
import matplotlib.pyplot as plt
import numpy as np
import time

testInstance = io.InputConverter()
start = time.time()
conversionError = io.ConversionError()
#f = testInstance.convert(r"S:\Python\", 1", conversionError)
f = testInstance.convert(r"/Users/Hugo/20160401", "201604010000",
conversionError)
end = time.time()
print("time elapsed " + str(end - start))

if(conversionError.conversionSucces):
    print("Conversion succesful")
if(conversionError.conversionSucces == False):
    print("Conversion failed: " + conversionError.conversionErrorLog)
print "Done!"

# Create a new subplot for two canals 1 & 3
a = np.amin(f.f)
filename = 'C:/Users/Hugo/20160401/201604010000.dat'
d = open(filename,'rb')
t = u"\u00b0"
headersize = 64
header = d.read(headersize)
ax1 = plt.subplot(211)
ax1.set_title(header[:16] + ', ' +                          # station name
     'Canals: '+header[32:33]+' and '+header[34:35]+ ', '   # canals
     +'Temp'+header[38:43]+t+'C'                            # temperature
    +', '+'Time:'+header[26:32]+', '+'Date'+' '+header[16:26])      # date

plt.ylabel('Pico Tesle [pT]')
plt.xlabel('Time [ms]')
plt.plot(f.f[0,], label='Canal 1', color='r', linewidth=0.75, linestyle="-")
plt.plot(f.f[1,], label='Canal 3', color='b', linewidth=0.75, linestyle="-")
plt.legend(loc='upper right', frameon=False)
plt.grid()
# Create a new subplot for FFT
plt.subplot(212)
plt.title('Fast Fourier Transform')
plt.ylabel('Power [a.u.]')
plt.xlabel('Frequency Hz')
FFTdata = np.sqrt(f.f[0,]*f.f[0,]+f.f[1,]*f.f[1,])**1
samples = FFTdata.size
duration = 300 # in seconds
Fs = float(samples)/duration # sampling frequency (sample/sec)
delta_t = 1.0/Fs
t = np.arange(0, samples, 1)*delta_t
FFTdata_freq = np.abs(np.fft.rfft(FFTdata))**2
freq = np.fft.rfftfreq(samples, d=delta_t)

# Printing data
plt.semilogy(freq, FFTdata_freq)
plt.grid()
#plt.savefig('S:/Hugo/'+"201604010000"+'.png', bbox_inches =
'tight')
plt.show()
f.f的内容:>>> print f.f[0,]
[ -59.57011259 -74.20675537 -90.53224156 ..., -1676.9703173 -1676.9703173 -1676.9703173 ]
>>> print f.f[1,]
[ 1.48413511e+00 4.96417605e+00 8.39303992e+00 ..., -1.67697032e+03 -1.67697032e+03 -1.67697032e+03]
iodata代码:
import struct
import numpy as np

class ConversionError:
    def __init__(self):
        self.conversionSucces = True
        self.conversionErrorLog = "Correct"

    def reportFailure(self, errorlog):
        self.conversionSucces = False
        self.conversionErrorLog = errorlog

class DataStruct:
    def __init__(self,f,initTime,headerString):
        self.f = f
        self.initTime = initTime
        self.headerString = headerString

class InputConverter:
    def __init__(self):
        self.midAdc = 65536/2
        self.convFactor = 19.54

    def convert(self,filePath,fileName,conversionLog):
        try:
            d_file = open(filePath + "/" + fileName + ".dat", mode='rb')
         except IOError as e:
            conversionLog.reportFailure(e.strerror)

        file = d_file.read()
        datalen = len(file)
        headerString = file[:43]
        initime, = struct.unpack('>H', file[48:50])
        expectedMatrixWidth = (datalen - 72)/4
        outputMatrix = np.zeros((2, expectedMatrixWidth))
        index = 0;
        print "Processing..."
        for i in range(64, datalen-8, 4):
            e1, e2 = struct.unpack('>HH',file[i:i+4])
            outputMatrix[0, index] = (e1 - self.midAdc)/self.convFactor
            outputMatrix[1, index] = (e2 - self.midAdc)/self.convFactor
            index += 1


        return DataStruct(outputMatrix,initime,headerString)
io.InputConverter。❷ 鉴于iodata模块没有文档(除了可能是 doc 字符串),除非您详细解释一下f是什么对象,否则很难提供帮助。您收到的答案似乎是合理的,如果答案对您不好,那是因为f不是ndarray(或者您没有完全理解答案,谁知道呢...)- 请编辑您的问题以解释您对iodata的使用。 - gboffi