将均值添加到geom_density_ridges

5

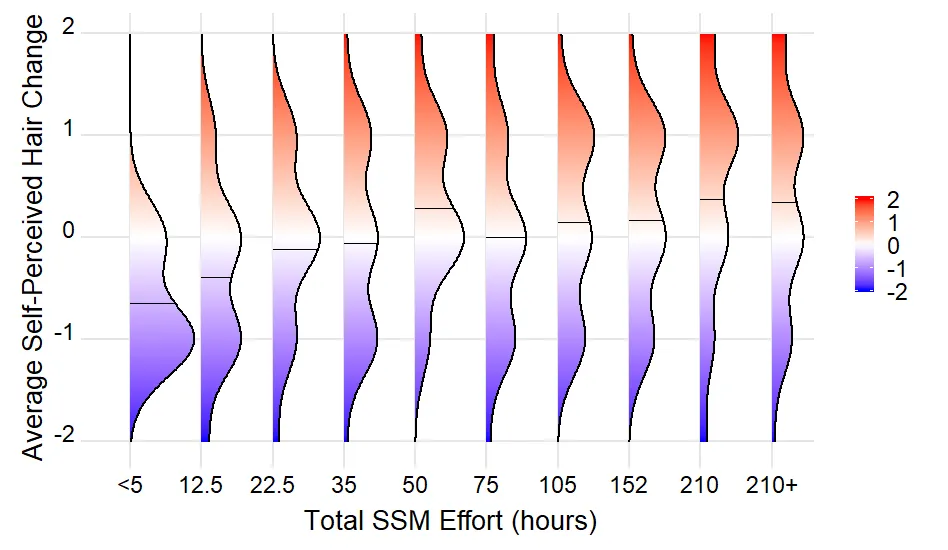
我正在尝试在ggplot2中使用geom_segment添加手段到geom_density_ridges图中。

library(dplyr)
library(ggplot2)
library(ggridges)

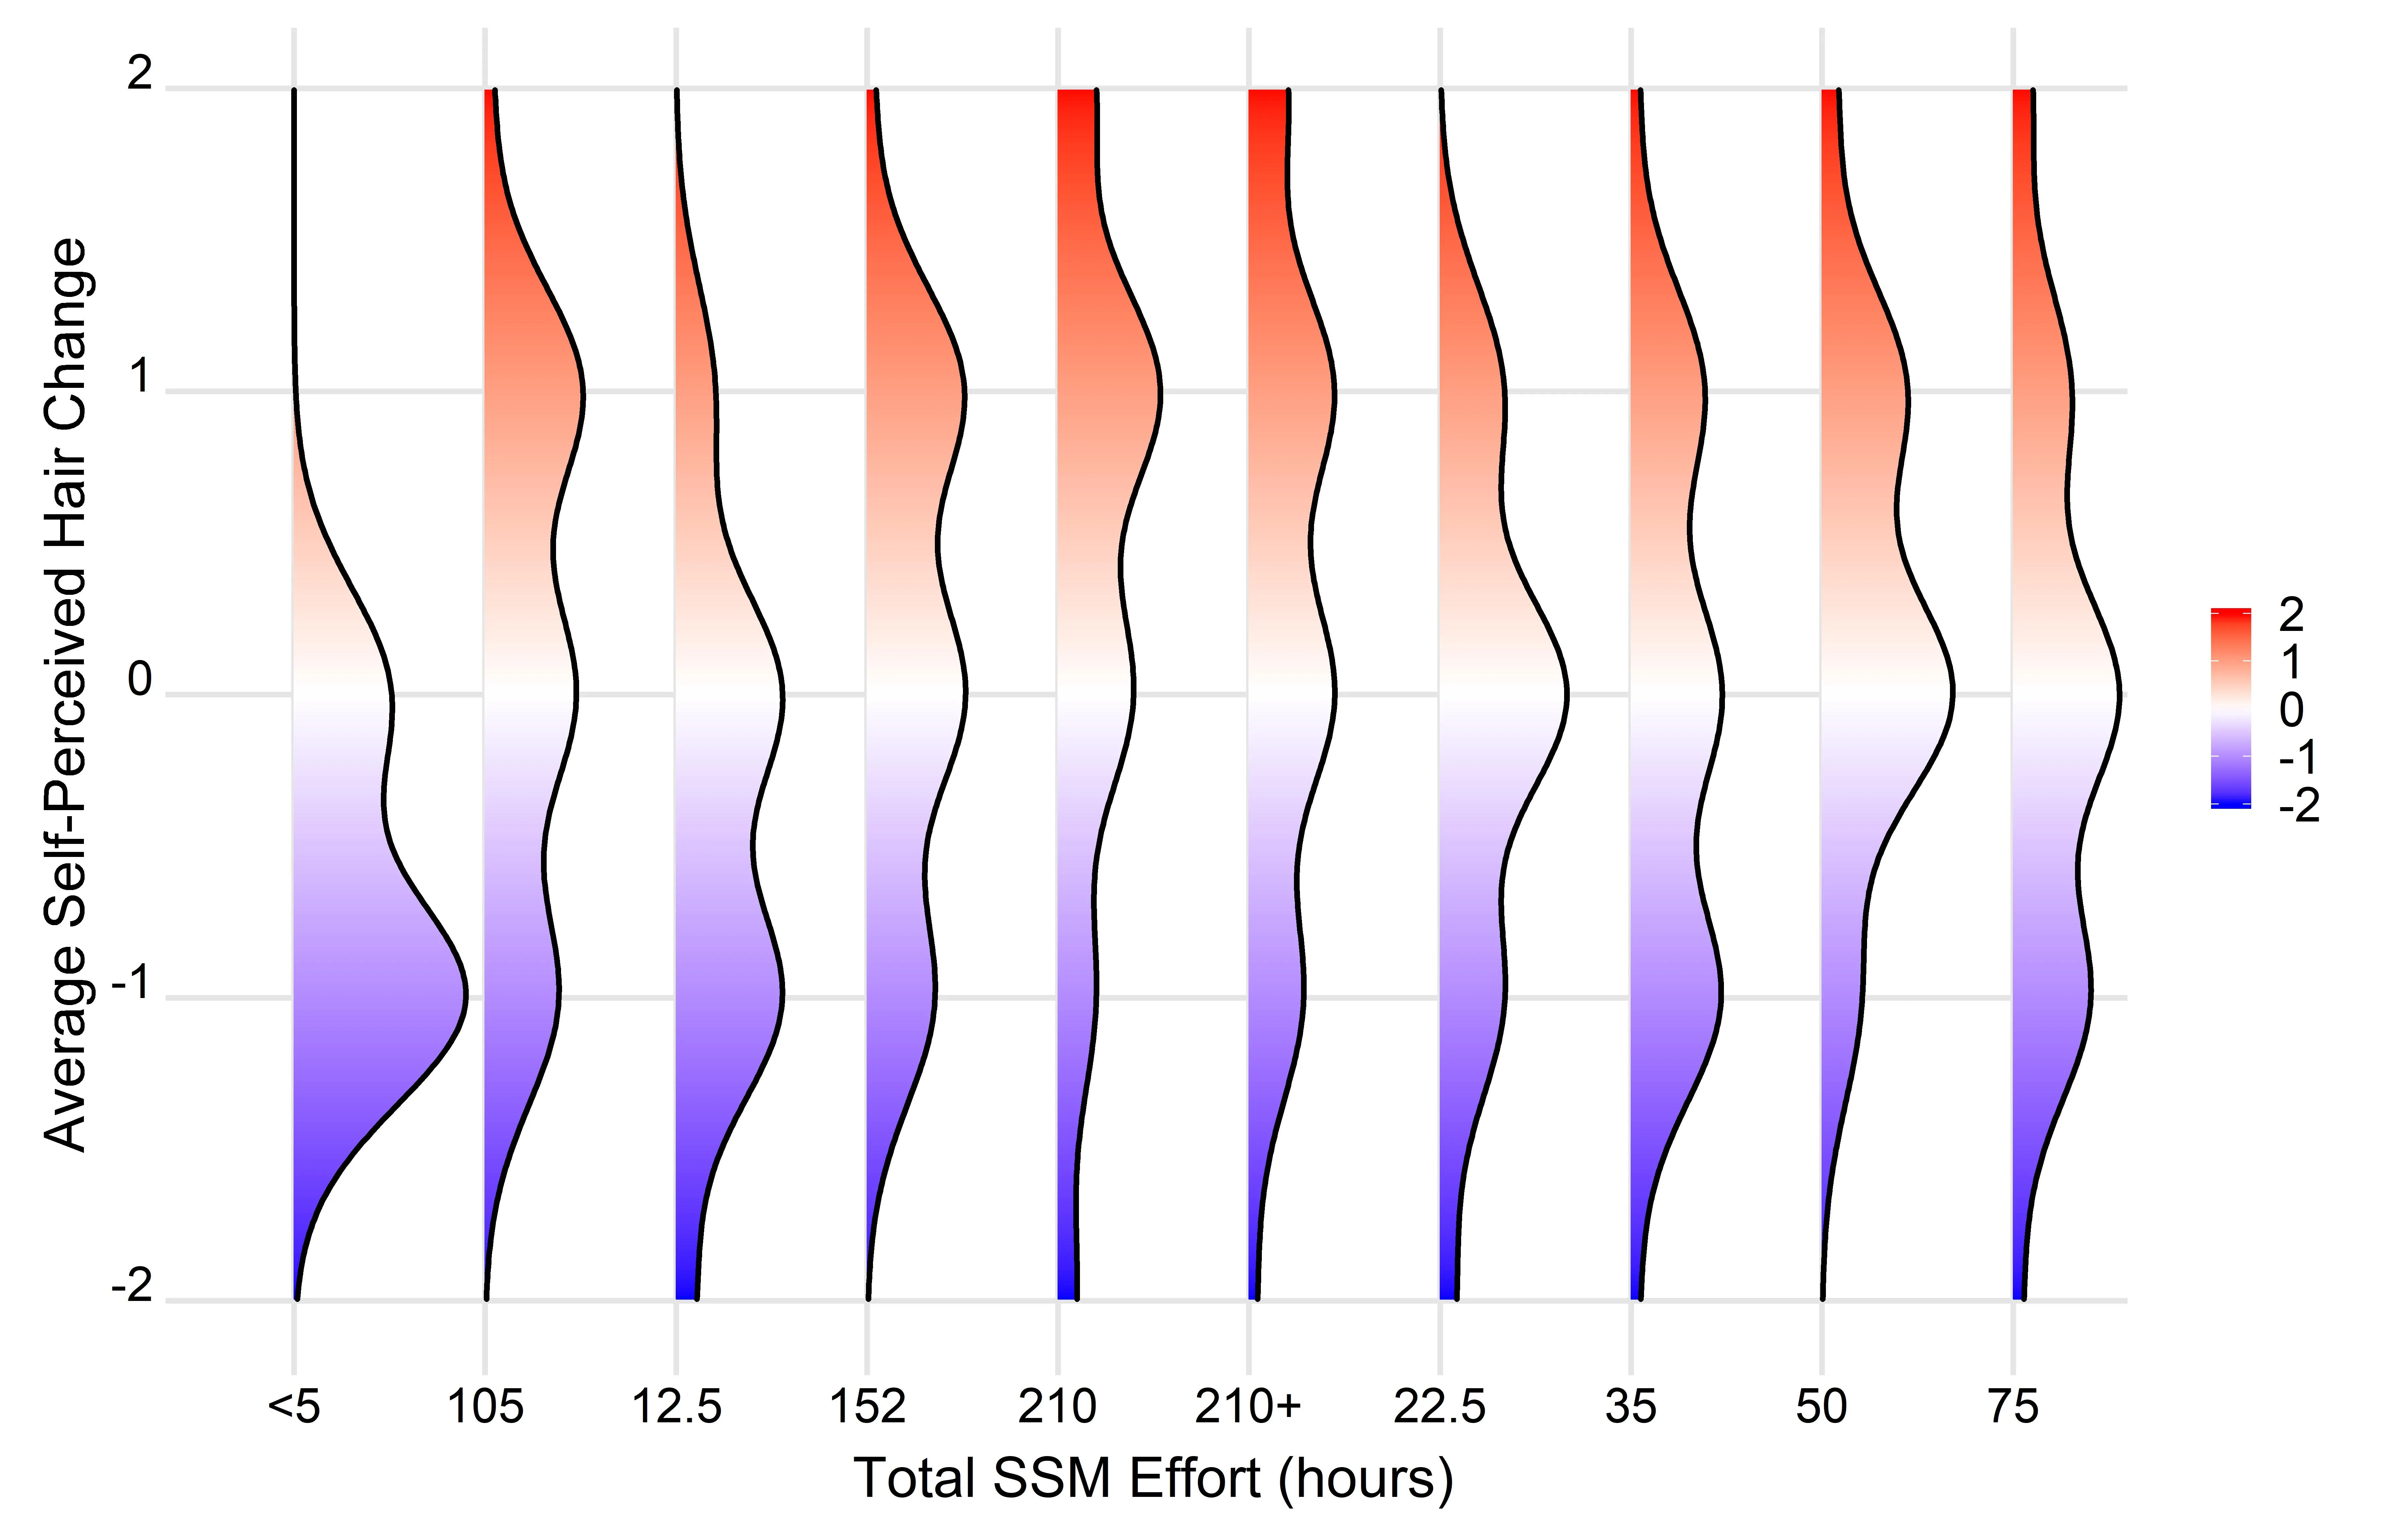
Fig1 <- ggplot(Figure3Data,  aes(x = `hairchange`, y = `EffortGroup`)) +
  geom_density_ridges_gradient(aes(fill = ..x..), scale = 0.9, size = 1) 

ingredients <- ggplot_build(Fig1) %>% purrr::pluck("data", 1)

density_lines <- ingredients %>%
  group_by(group) %>% filter(density == mean(density)) %>% ungroup()

p <- ggplot(Figure3Data,  aes(x = `hairchange`, y = `EffortGroup`)) +
  geom_density_ridges_gradient(aes(fill = ..x..), scale = 0.9, size = 1) +
  scale_fill_gradientn(  colours = c("#0000FF", "#FFFFFF", "#FF0000"),name = 
  NULL, limits=c(-2,2))+ coord_flip() +
  theme_ridges(font_size = 20, grid=TRUE, line_size=1, 
               center_axis_labels=TRUE) + 
  scale_x_continuous(name='Average Self-Perceived Hair Change', limits=c(-2,2))+ 
  ylab('Total SSM Effort (hours)')+
  geom_segment(data =density_lines, 
               aes(x = x, y = ymin, xend = x, yend = ymin+density*scale*iscale))

print(p)

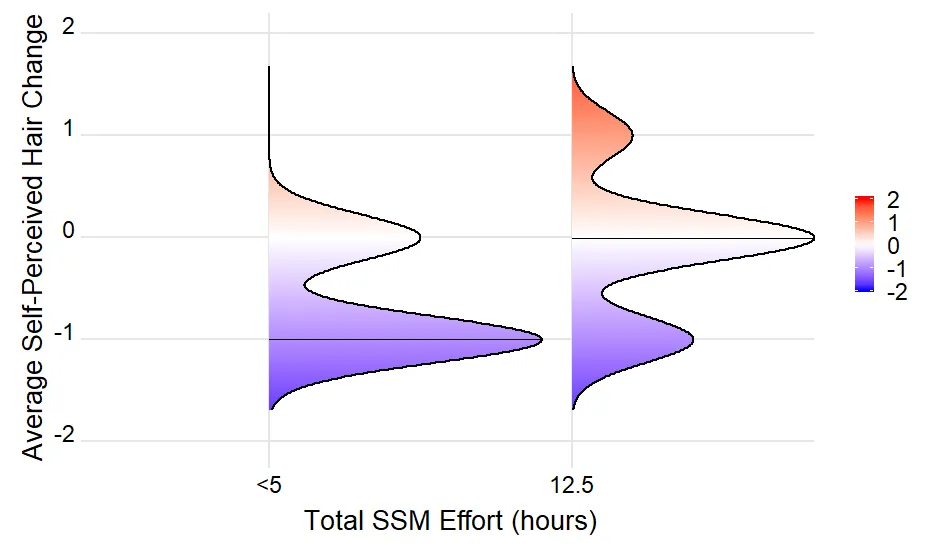
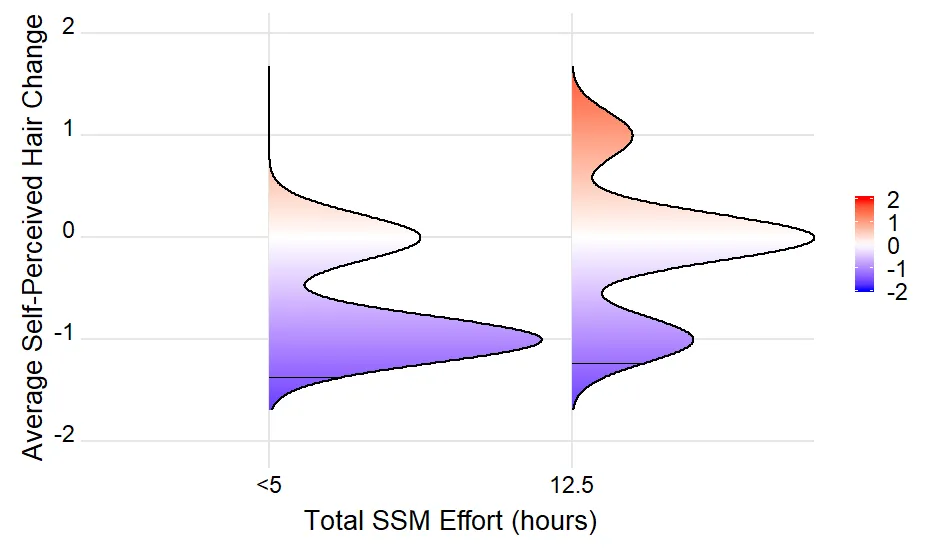
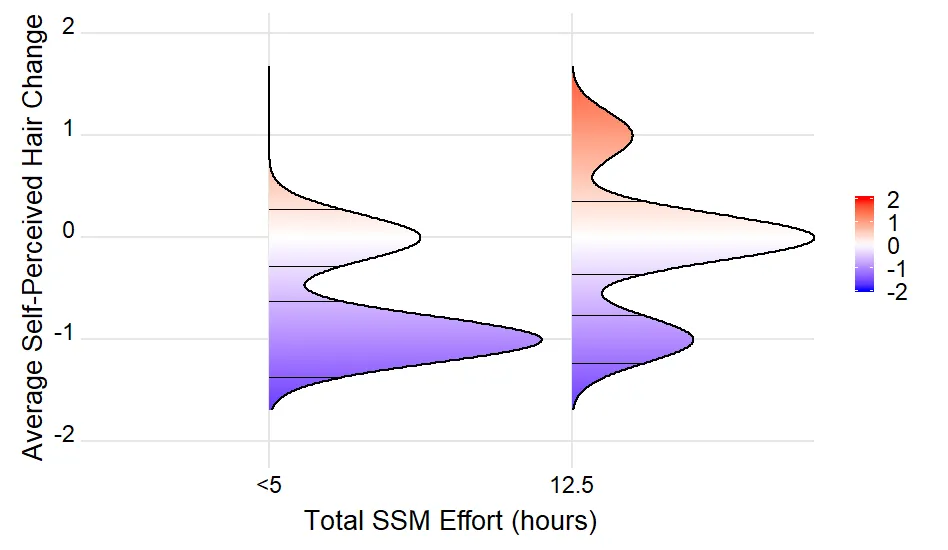
然而,我遇到了以下错误:“错误:data必须具有唯一名称,但存在重复元素”。下面是一个没有数据集均值的图。有什么建议可以修复代码吗?

Density Plot

前35行数据如下:

structure(list(MonthsMassage = c(0, 0, 0, 0, 0, 0, 0, 0, 0, 0, 
0, 0, 0, 1, 1, 1, 1, 1, 1, 1, 1, 1, 1, 1, 1, 1, 1, 1, 2, 2, 2, 
2, 2, 1, 1), MinutesPerDayMassage = c("0-10 minutes daily", "0-10 minutes daily", 
"0-10 minutes daily", "0-10 minutes daily", "0-10 minutes daily", 
"0-10 minutes daily", "0-10 minutes daily", "11-20 minutes daily", 
"11-20 minutes daily", "11-20 minutes daily", "0-10 minutes daily", 
"0-10 minutes daily", "0-10 minutes daily", "0-10 minutes daily", 
"0-10 minutes daily", "11-20 minutes daily", "11-20 minutes daily"
), Minutes = c(5, 5, 5, 5, 5, 5, 5, 5, 5, 5, 15, 15, 15, 5, 5, 
5, 5, 5, 5, 5, 5, 5, 5, 5, 5, 5, 5, 5, 5, 5, 5, 5, 5, 15, 15), 
    hairchange = c(-1, -1, 0, -1, 0, -1, -1, 0, 0, -1, 0, -1, 
    -1, 0, 0, -1, 0, -1, 0, -1, -1, -1, -1, -1, 0, -1, -1, -1, 
    0, 1, -1, 0, 0, -1, 0), HairType1 = c("Templefrontal", "Templefrontal", 
    "Templefrontal", "Templefrontal", "Templefrontal", "Templefrontal", 
    "Templefrontal", "other", "Templefrontal", "Templefrontal", 
    "Templefrontal", "Templefrontal", "Templefrontal", "Templefrontal", 
    "Templefrontal", "Templefrontal", "Templefrontal", "Templefrontal", 
    "Templefrontal", "Templefrontal", "Templefrontal", "Templefrontal", 
    "Templefrontal", "Templefrontal", "Templefrontal", "other", 
    "other", "other", "Templefrontal", "Templefrontal", "other", 
    "Templefrontal", "other", "Templefrontal", "Templefrontal"
    ), HairType2 = c("other", "other", "other", "other", "other", 
    "other", "other", "other", "other", "Vertexthinning", "Vertexthinning", 
    "other", "Vertexthinning", "other", "other", "Vertexthinning", 
    "other", "Vertexthinning", "Vertexthinning", "other", "other", 
    "other", "Vertexthinning", "other", "Vertexthinning", "other", 
    "other", "other", "other", "other", "other", "Vertexthinning", 
    "other", "other", "other"), HairType3 = c("other", "Diffusethinning", 
    "other", "Diffusethinning", "other", "other", "Diffusethinning", 
    "Diffusethinning", "Diffusethinning", "other", "Diffusethinning", 
    "Diffusethinning", "other", "other", "Diffusethinning", "Diffusethinning", 
    "other", "Diffusethinning", "Diffusethinning", "Diffusethinning", 
    "other", "other", "other", "other", "other", "other", "other", 
    "other", "other", "Diffusethinning", "other", "other", "other", 
    "other", "other"), Effort = c(0, 0, 0, 0, 0, 0, 0, 0, 0, 
    0, 0, 0, 0, 2.5, 2.5, 2.5, 2.5, 2.5, 2.5, 2.5, 2.5, 2.5, 
    2.5, 2.5, 2.5, 2.5, 2.5, 2.5, 5, 5, 5, 5, 5, 7.5, 7.5), EffortGroup = c("<5", 
    "<5", "<5", "<5", "<5", "<5", "<5", "<5", "<5", "<5", "<5", 
    "<5", "<5", "<5", "<5", "<5", "<5", "<5", "<5", "<5", "<5", 
    "<5", "<5", "<5", "<5", "<5", "<5", "<5", "12.5", "12.5", 
    "12.5", "12.5", "12.5", "12.5", "12.5")), row.names = c(NA, 
-35L), class = c("tbl_df", "tbl", "data.frame"))

欢迎来到SO。错误信息与您的数据有关。因此,请[编辑]您的问题并发布您的数据,最好是dput(...)的结果(如果这太大,则为dput(head(...)))。我们需要一个可重现的示例来回答您的问题。谢谢。 - Uwe
请问您能否发布str(density_lines)的结果? - Uwe
没有str(density_lines)的结果(27个变量中的0个对象),但是当我用max(density)替换mean(density)时,代码可以运行,并且我得到了以下结果(27个变量中的10个对象)。我试图将数据的第一行dput出来,但是它太长了,无法在这里发布。感谢您的帮助! - jbearazesh
1
感谢提供 dput() 结果。这足以重现问题。density_lines 是空的,因为没有记录具有与 mean(density) 完全相等的 density 值。使用 max(density),为每个山脊线绘制一条水平线。这是你想要的吗?或者,你想要为每个山脊线的峰值(和可能的低谷)绘制一条水平线? - Uwe
还有一个问题。构成y轴(总SSM工作量(小时))的分组变量EffortGroup被强制转换为因子进行绘图。因子水平按字母顺序排序,这会导致错误的顺序。我建议将EffortGroup转换为因子,并以正确顺序明确指定因子水平。 - Uwe
谢谢Uwe!我想要的是在每个山脊线处密度等于平均密度的位置上画一条水平线。由于平均值不起作用,是否可以创建一个包含每个10个山脊线的平均值(使用ddply计算)的数组,然后使用调用该区域的geom_segment作为y位置? - jbearazesh
1个回答

6

绘制水平线

如果我理解正确,OP想在每个山脊线上密度等于平均密度的位置上绘制一条水平线。

表达式:

density_lines <- ingredients %>%
  group_by(group) %>% filter(density == mean(density)) %>% ungroup()

由于没有记录的密度值恰好与平均密度匹配,因此返回一个空数据集。

但是,它适用于整体最大值(但不适用于所有局部最大值)。

density_lines <- ingredients %>%
  group_by(group) %>% filter(density == max(density)) %>% ungroup()

这提供了

enter image description here

查找最接近的值

由于没有完全匹配,可以通过查找最接近的值来选择。

density_lines <- ingredients %>%
  group_by(group) %>% 
  top_n(1, -abs(density - mean(density))) 

它的图形如下

enter image description here

这将在每个山脊线上绘制一个线段,但我们希望在每个曲线分支中看到4个线段(其中相邻峰值的最大值大于平均值)。使用
density_lines <- ingredients %>%
  group_by(group) %>% 
  top_n(4, -abs(density - mean(density))) 

我们得到

enter image description here

你可以尝试调整top_n()函数中的n参数,但在我看来,正确的方式是将每个山峰到谷底和每个谷底到山峰的岭线分组,以获取每个曲线分支的一个段。

查找附近的值

或者,我们可以使用near()函数进行筛选。该函数需要指定一个容差tol,我们需要从数据集中计算出它:

density_lines <- ingredients %>%
  group_by(group) %>% 
  filter(near(
    density, mean(density), 
    tol = ingredients %>% summarise(0.25 * max(abs(diff(density)))) %>% pull()
  )) 

对于经过精心筛选的因子 0.25(尝试和错误),我们确实得到了

enter image description here

编辑:绘制垂直线

看起来我误解了OP的意图。现在,我们将尝试使用geom_hline(配合coord_flip()geom_hline()可以创建垂直线)在mean(density)处绘制一条垂直线。

同样地,我们遵循OP聪明的方法从创建的图中提取密度和比例因子。

# create plot object
Fig1 <- ggplot(Figure3Data,  aes(x = hairchange, y = EffortGroup)) +
  geom_density_ridges_gradient(aes(fill = ..x..), scale = 0.9, size = 1) +
  scale_fill_gradientn(
    colours = c("#0000FF", "#FFFFFF", "#FF0000"),
    name =
      NULL,
    limits = c(-2, 2)
  ) + coord_flip() +
  theme_ridges(
    font_size = 20,
    grid = TRUE,
    line_size = 1,
    center_axis_labels = TRUE
  ) +
  scale_x_continuous(name = 'Average Self-Perceived Hair Change', limits =
                       c(-2, 2)) +
  ylab('Total SSM Effort (hours)')

# extract plot data and summarise
mean_density <- 
  ggplot_build(Fig1) %>% 
  purrr::pluck("data", 1) %>%
  group_by(group) %>% 
  summarise(density = mean(density), scale = first(scale), iscale = first(iscale))

# add hline and plot
Fig1 +
  geom_hline(aes(yintercept = group + density * scale * iscale),
             data = mean_density)

enter image description here

编辑 2:在平均值处绘制水平线,表示自我感知头发变化

原帖已经澄清

我想要的是每个山脊线上的平均自我感知头发变化(y轴数据)。

可以通过以下步骤实现:

  1. 创建ridgeplot对象。
  2. 计算每个EffortGroup的平均自我感知头发变化
  3. 从图形数据中选择创建的密度值的值。
  4. 连接两个数据集。
  5. 使用approx()计算平均值位置处的密度值。
  6. 绘制线段。

每个EffortGroup的平均自我感知头发变化是通过以下方式计算的:

Figure3Data %>% 
  group_by(EffortGroup) %>% 
  summarise(x_mean = mean(hairchange))

对于OP数据的发布子集,产生以下结果:

  EffortGroup x_mean
  <chr>        <dbl>
1 <5          -0.643
2 12.5        -0.143

所有步骤如下:

# create plot object
Fig1 <- ggplot(Figure3Data,  aes(x = hairchange, y = EffortGroup)) +
  geom_density_ridges_gradient(aes(fill = ..x..), scale = 0.9, size = 1) +
  scale_fill_gradientn(
    colours = c("#0000FF", "#FFFFFF", "#FF0000"),
    name = NULL,
    limits = c(-2, 2)) + 
  coord_flip() +
  theme_ridges(
    font_size = 20,
    grid = TRUE,
    line_size = 1,
    center_axis_labels = TRUE) +
  scale_x_continuous(name = 'Average Self-Perceived Hair Change', 
                     limits = c(-2, 2)) +
  ylab('Total SSM Effort (hours)')

density_lines <-
  Figure3Data %>% 
  group_by(EffortGroup) %>% 
  summarise(x_mean = mean(hairchange)) %>% 
  mutate(group = as.integer(factor(EffortGroup))) %>% 
  left_join(ggplot_build(Fig1) %>% purrr::pluck("data", 1), 
            on = "group") %>% 
  group_by(group) %>%
  summarise(x_mean = first(x_mean), 
            density = approx(x, density, first(x_mean))$y, 
            scale = first(scale), 
            iscale = first(iscale))

# add segments and plot
Fig1 +
  geom_segment(aes(x = x_mean,
                   y = group,
                   xend = x_mean,
                   yend = group + density * scale * iscale),
               data = density_lines)

enter image description here

编辑 3:重新排序水平轴

原帖中提到需要适当地重新排序水平轴。这可以通过将EffortGroupcharacter类型强制转换为factor类型来实现,其中因子级别在预期顺序中明确指定:

# turn EffortGroup into factor with levels in desired order
lvls <- c("<5", "12.5", "22.5", "35", "50", "75", "105", "152", "210", "210+")
Figure3Data <- 
  Figure3Data %>% 
  mutate(EffortGroup = factor(EffortGroup, levels = lvls))

或者,可以通过直接从给定的Effort值派生EffortGroup

# create Effort Group from scratch
lvls <- c("<5", "12.5", "22.5", "35", "50", "75", "105", "152", "210", "210+")
brks <- c(-Inf, 5, 12.5, 22.5, 35, 50, 75, 105, 152, 210, Inf)
Figure3Data <- 
  Figure3Data %>% 
  mutate(EffortGroup = cut(Effort, brks, lvls, right = FALSE))

无论如何,由于EffortGroup已经是一个因子,因此必须修改density_lines的计算方式:
density_lines <-
  Figure3Data %>% 
  group_by(EffortGroup) %>% 
  summarise(x_mean = mean(hairchange)) %>% 
  mutate(group = as.integer(EffortGroup)) %>%   # remove call to factor() here
  left_join( ...

使用OP提供的完整数据集(链接),绘图最终变得更加清晰。

enter image description here

每个 EffortGroup 的平均 自我感知的头发变化 位置如下:
Figure3Data %>% 
  group_by(EffortGroup) %>% 
  summarise(x_mean = mean(hairchange)) 
# A tibble: 10 x 2
   EffortGroup  x_mean
   <fct>         <dbl>
 1 <5          -0.643 
 2 12.5        -0.393 
 3 22.5        -0.118 
 4 35          -0.0606
 5 50           0.286 
 6 75           0     
 7 105          0.152 
 8 152          0.167 
 9 210          0.379 
10 210+         0.343

谢谢Uwe。我想在每个山脊线的位置添加一行,该行位于平均密度的位置。是否可以从下面计算出的平均值数组中调用值? 结构(列表(EffortGroup = c("<5", "105", "12.5", "152", "210", "210+", "22.5", "35", "50", "75"), mean = c(-0.642857142857143, 0.151515151515152, -0.392857142857143, 0.166666666666667, 0.379310344827586, 0.342857142857143, -0.117647058823529, -0.0606060606060606, 0.285714285714286, 0)), class = "data.frame", row.names = c(NA, -10L)) - jbearazesh
感谢您对竖直线的帮助,但是我理想中想要的是每个10条脊线的平均自我感知头发变化(y轴数据)。例如,使用上面的数据,我知道<5和12.5总SSM努力的平均值分别为-0.643和-0.392。我想在<5密度脊线处延伸一条水平线,其值为-0.643,在12.5密度脊线处延伸一条水平线,其值为-0.392,以此类推。 - jbearazesh
嘿,Uwe,我在绘制图表时仍然遇到麻烦。首先,在这一行中 mutate(group = as.integer(factor(EffortGroup))) %>% 我得到了 Error in factor(EffortGroup) : object 'EffortGroup' not found 的错误。不确定该怎么办?其次,有没有办法使x轴按数字递增的方式绘制,而不是按字母顺序绘制?目前,它正在绘制为 structure(list(EffortGroup = c("<5", "105", "12.5", "152", "210", "210+", "22.5", "35", "50", "75"), 但我想要 <5、12.5、22.5 等等。 - jbearazesh
谢谢。我的数据集中仍然有EffortGroup,当它在ggplot行中早期被调用时,它可以正常工作。这可能与我无法使用您提供的代码复制每个EffortGroup的平均自我感知头发变化有关,即Figure3Data%>% group_by(EffortGroup)%>% summarise(x_mean = mean(hairchange))这将产生0.02,这是整个数据集的平均值。 - jbearazesh
第三次编辑非常有帮助。完整数据集:http://s000.tinyupload.com/?file_id=69397165619155339536 - jbearazesh
显示剩余3条评论

网页内容由stack overflow 提供, 点击上面的
可以查看英文原文,
原文链接