我正在使用 R Markdown 创建一个 PDF 输出的文档。
我的代码在 "for" 循环中创建了许多表格和图形,在同一个代码块中。我看到的所有技巧 - 使用各种组合和排列的斜杠和空格(例如 newline、linebreak、 、
等)创建 PDF 文档中的换行符都不起作用。所以,我决定走捷径,在 ggplot2 中增加绘图区域的边距,以营造出我表格和图形之间更多的白色空间的幻觉。
- 理想情况下,我想知道如何在单个代码块中实际地正确插入白色空间(一行或几行),而不会出现错误。
- 但是,我也愿意弄清楚为什么以下代码在我的 ggplot2 绘图中产生额外的空格,当我有一些背景颜色时(第一个绘图),但是当背景颜色是白色时 却不能 产生相同的效果!?这真是奇怪的行为啊!
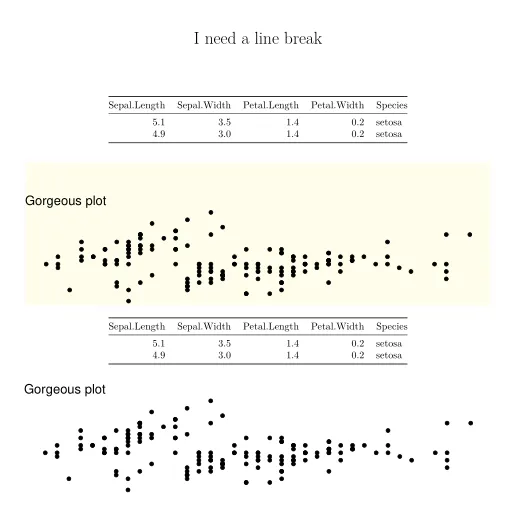
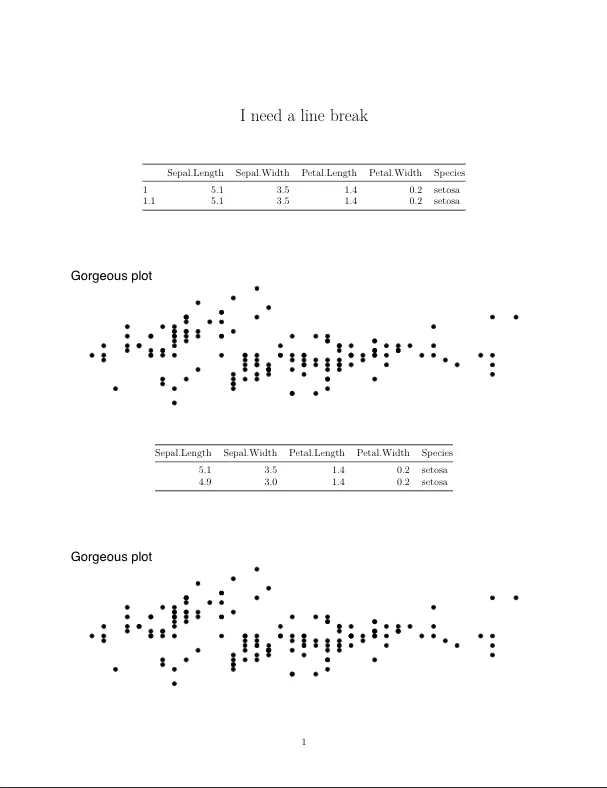
请参见下面的截图和代码,其中包含两个相同的代码块 - 除了绘图的背景颜色 - 其中一个具有浅米黄色背景的绘图显示了表格和绘图标题之间所需的 "白色空间",而后面的绘图(白色背景)则不显示相同的 "白色空间"。
---
title: "I need a line break"
output: pdf_document
---

```{r setup, include=FALSE}
library(ggplot2)
library(knitr)
library(ggplot2)
knitr::opts_chunk$set(echo = FALSE,
                  include = TRUE,
                  message = FALSE,
                  warning = FALSE,
                  error = FALSE)
```

```{r, results = "asis", fig.height = 2}
for (i in 1) {
mytable <- kable((iris[c(1,2),]), booktabs = TRUE)

print(mytable)

myplot <- ggplot(iris) +
labs(title = "Gorgeous plot") +
geom_point(aes(Sepal.Length, Sepal.Width)) +
theme_void() +
theme(plot.background = element_rect(fill = "#FFFEEB", color = "white"),
  plot.margin = unit(c(1, 0, 0, 0), "cm"))
print(myplot)
}
```


```{r, results = "asis", fig.height = 2}
for (i in 1) {
mytable <- kable((iris[c(1,2),]), booktabs = TRUE)

print(mytable)

myplot <- ggplot(iris) +
labs(title = "Gorgeous plot") +
geom_point(aes(Sepal.Length, Sepal.Width)) +
  theme_void() +
  theme(plot.background = element_rect(fill = "white", color = "white"),
  plot.margin = unit(c(1, 0, 0, 0), "cm"))

print(myplot)
}
```
cat("\\linebreak")之后再添加一个额外的cat("\\ "),但是没错 - 这就解决了问题。我必须承认,我仍然对图中奇怪的间距问题很好奇,但我可以随时提出另一个问题或在github上发布一个问题。我会尽快给你支付赏金! - NovasessionInfo()的输出和渲染.Rmd文件所使用的pandoc / cairo /其他版本。我怀疑这与取消主题有关(即theme_void()cf.theme_classic()),但是由于无法重现该问题,我无法提出解决方案,抱歉。 - jared_mamrot