最好使用 .pdf 格式,因为该格式设计为缩放时不会更改。您可以简单地使用
for 循环或可能更好的
Map 来创建图形,然后使用
cat 生成“原样” LaTeX 代码。我在这里使用基本图形,我相信您也可以使用
ggplot2 进行此操作。在
Map 周围包装一个
invisible 来省略控制台输出。
---
title: "Untitled"
output: pdf_document
header-includes:
- \usepackage{lipsum} % just used for sample loremipsum text
---
\lipsum[1]
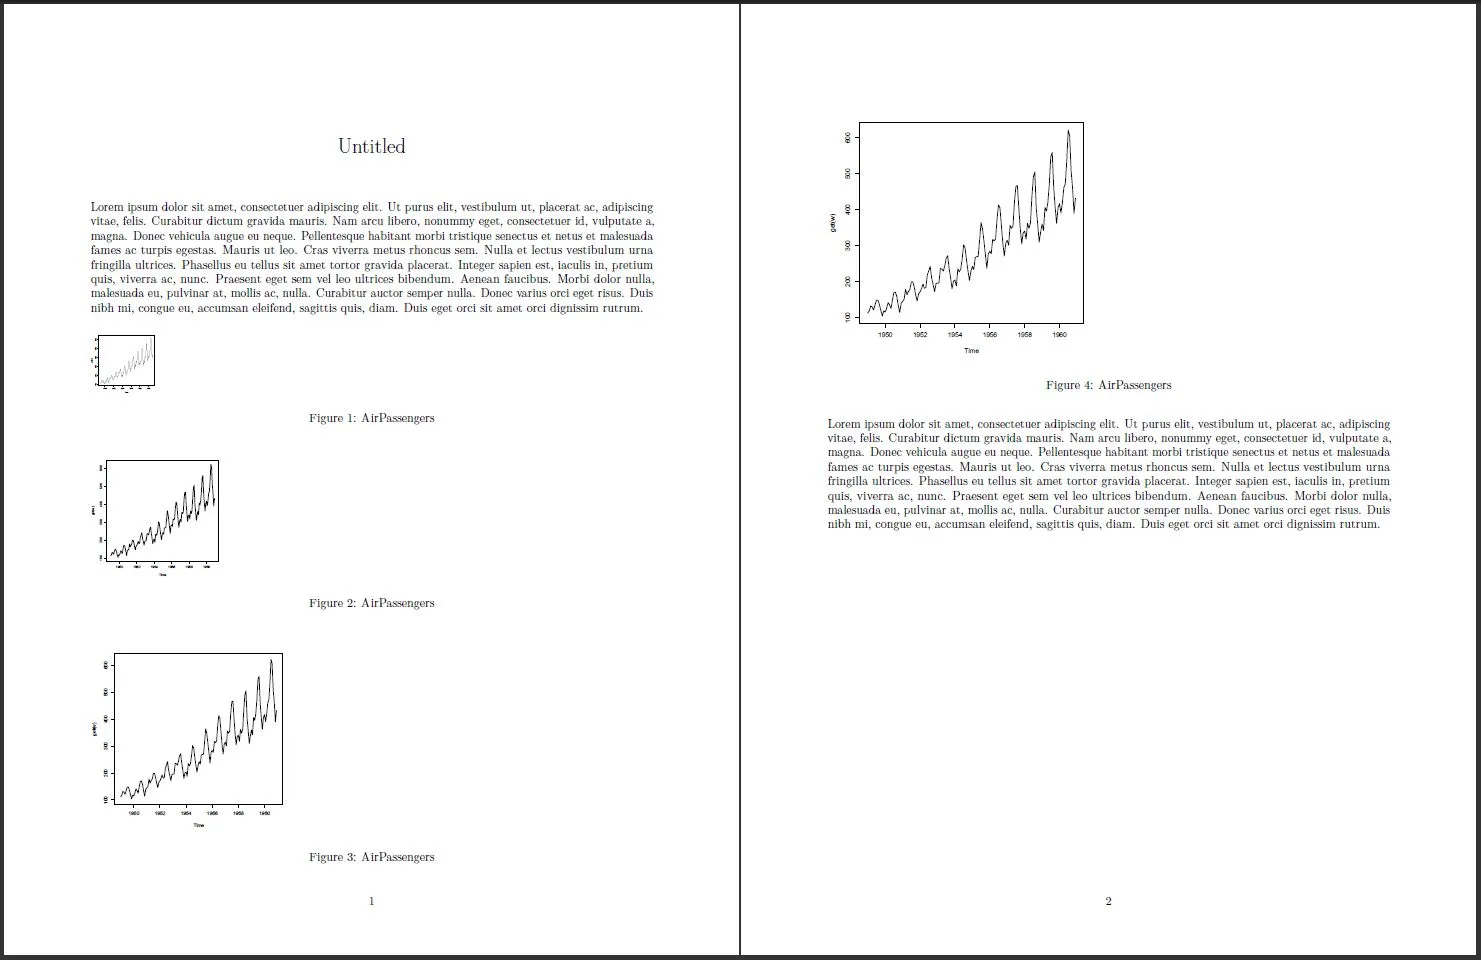
```{r plots, echo=FALSE, results="asis"}
what <- rep("AirPassengers", 4) ## mimicking multiple plots
invisible(Map(function(w) {
pdf(file=paste0(w, ".pdf"))
plot(get(w))
dev.off()
}, what))
heights <- c(2, 4, 6, 8) ## define heights for each plot
invisible(Map(function(w, h) cat(
"
\\begin{figure}[ht]
\\includegraphics[height=", paste0(h, "cm"), "]{", paste0(w, ".pdf"), "}
\\caption{", w, "}\\label{fig:", w, "}
\\end{figure}
", sep=""), what, heights))
```
\lipsum[1]
产生:
如果您只想要不同的高度,您可以在第一个Map调用中指定尺寸,例如使用第二个参数来设置宽度,并在第二个调用中使用常量高度/宽度。