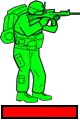
如承诺的那样,我已经包含了我的完整、可工作的代码。这个函数将标记绘制为画布图像。士兵和他的生命条分别绘制,因为士兵通常是静态的(除非我们想通过画布来动画化他),但当他受到攻击时,生命条会发生变化。我已经在我的游戏中测试了代码,它完美地工作。
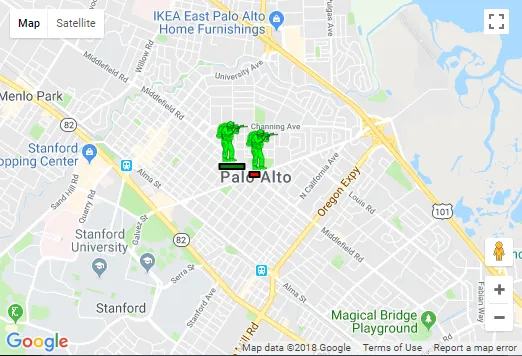
geocodezip,出于性能原因,我最终没有采用您的建议,主要原因是不想将游戏中的标记数量翻倍。一个玩家可以在游戏中拥有数百个单位,而任何时候都可能有数百名玩家,因此为了实现我想要的效果而翻倍标记可能会影响性能。不过,您的代码很棒,我可能会在不会影响性能的情况下使用它。
以下是代码:
function createUnitMarker(latLng, unitData) {
var img = new Image();
img.crossOrigin = "Anonymous";
img.src = 'http://yourservername.com/' + unitData.icon;
img.onload = function() {
var canvas, context;
var color = "blue";
var healthBar = {
width: 62,
height: 10,
x: 5,
y: 82
}
canvas = document.createElement("canvas");
context = canvas.getContext("2d");
canvas.width = unitData.width;
canvas.height = unitData.height;
function drawBar(percent, color) {
context.fillStyle = "gray";
context.fillRect(healthBar.x, healthBar.y, healthBar.width, healthBar.height);
if (typeof percent == undefined || percent == null || percent == NaN) {
percent = 100;
}
if (typeof color == undefined || color == null || color == NaN) {
color = "green";
}
var width = Math.min(percent * healthBar.width, healthBar.width);
width = Math.max(width, 0);
if (percent < 0.4) {
color = "red";
}
else if (percent < 0.7) {
color = "orange";
}
else {
color = "green";
}
context.fillStyle = color;
context.fillRect(healthBar.x, healthBar.y, width, healthBar.height);
context.lineWidth = 2;
context.strokeStyle = "black";
context.strokeRect(healthBar.x, healthBar.y, healthBar.width, healthBar.height);
}
function drawIcon(img, width, height) {
if (typeof img === "undefined" || img === null || img === "" || img === NaN) {
img = img;
}
if (typeof width === "undefined" || width === null || width === "" || width === NaN) {
width = unitData.width;
}
if (typeof height === "undefined" || height === null || height === "" || height === NaN) {
height = unitData.height;
}
context.clearRect(0, 0, width, height);
context.save();
context.drawImage(img, 0, 0);
context.restore();
}
drawIcon(img, unitData.width, unitData.height);
var icon = {
url: canvas.toDataURL(),
size: new google.maps.Size(unitData.width, unitData.height),
origin: new google.maps.Point(0, 0),
labelOrigin: new google.maps.Point(25, 40),
anchor: new google.maps.Point(unitData.width / 2, unitData.height / 2)
}
var marker = new google.maps.Marker({
position: latLng,
label: {
color: "yellow",
fontFamily: "Oswald",
fontSize: "20px",
fontWeight: "bold",
text: unitData.unit_ID.toString(),
visibility: "hidden"
},
title: "Infantry",
icon: icon,
animation: google.maps.Animation.DROP,
unitID: unitData.unit_ID,
etc: 0
});
marker.setMap(gv.map);
var healthPercent = marker.current_health / marker.max_health;
drawBar(healthPercent);
icon.url = canvas.toDataURL();
icon = JSON.parse(JSON.stringify(icon));
marker.setIcon(icon);
marker.addListener('label_changed', function() {
healthPercent = this.current_health / this.max_health;
drawBar(healthPercent);
icon = {
url: canvas.toDataURL(),
size: new google.maps.Size(unitData.width, unitData.height),
origin: new google.maps.Point(0, 0),
labelOrigin: new google.maps.Point(25, 40),
anchor: new google.maps.Point(unitData.width / 2, unitData.height / 2)
}
icon = JSON.parse(JSON.stringify(icon));
this.setIcon(icon);
});
}
}