以下是一个NLTK解决方案,它忽略英语停用词(例如:in,on,of,the等):
import matplotlib
import matplotlib.pyplot as plt
import pandas as pd
import nltk

top_N = 10

df = pd.read_csv(r'/path/to/imdb-5000-movie-dataset.zip',
                 usecols=['movie_title','plot_keywords'])

txt = df.plot_keywords.str.lower().str.replace(r'\|', ' ').str.cat(sep=' ')
words = nltk.tokenize.word_tokenize(txt)
word_dist = nltk.FreqDist(words)

stopwords = nltk.corpus.stopwords.words('english')
words_except_stop_dist = nltk.FreqDist(w for w in words if w not in stopwords)

print('All frequencies, including STOPWORDS:')
print('=' * 60)
rslt = pd.DataFrame(word_dist.most_common(top_N),
                    columns=['Word', 'Frequency'])
print(rslt)
print('=' * 60)

rslt = pd.DataFrame(words_except_stop_dist.most_common(top_N),
                    columns=['Word', 'Frequency']).set_index('Word')

matplotlib.style.use('ggplot')

rslt.plot.bar(rot=0)
输出:
All frequencies, including STOPWORDS:
============================================================
     Word  Frequency
0      in        339
1  female        301
2   title        289
3  nudity        259
4    love        248
5      on        240
6  school        238
7  friend        228
8      of        222
9     the        212
============================================================
Pandas解决方案,使用了来自NLTK模块的停用词:
from collections import Counter
import pandas as pd
import nltk
top_N = 10
df = pd.read_csv(r'/path/to/imdb-5000-movie-dataset.zip',
usecols=['movie_title','plot_keywords'])
stopwords = nltk.corpus.stopwords.words('english')
RE_stopwords = r'\b(?:{})\b'.format('|'.join(stopwords))
words = (df.plot_keywords
.str.lower()
.replace([r'\|', RE_stopwords], [' ', ''], regex=True)
.str.cat(sep=' ')
.split()
)
rslt = pd.DataFrame(Counter(words).most_common(top_N),
columns=['Word', 'Frequency']).set_index('Word')
print(rslt)
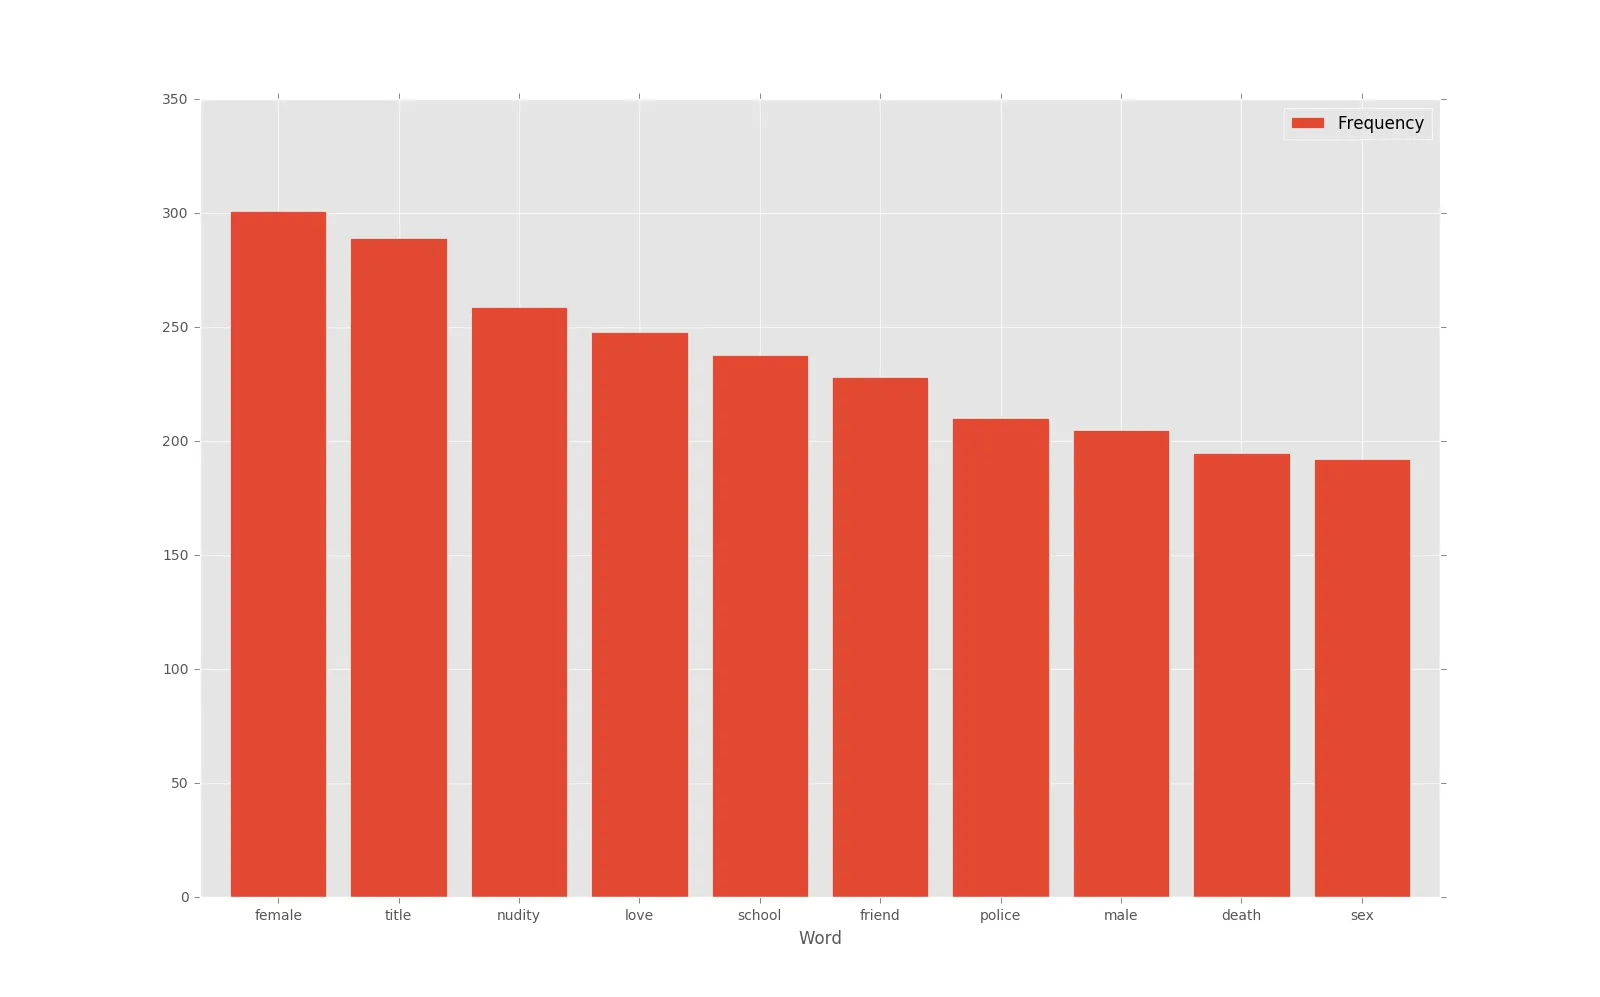
rslt.plot.bar(rot=0, figsize=(16,10), width=0.8)
输出:
        Frequency
Word
female        301
title         289
nudity        259
love          248
school        238
friend        228
police        210
male          205
death         195
sex           192