如何在lattice中的xy图中添加水平线

4
我将使用格子图来生成下面的图片。
生成图像的代码如下:
xyplot(RMSE ~ Dimensions, data=afterdim,groups = paste("", Dim_Reduction),
type = "l", auto.key =list(spline = "bottom", points = FALSE, lines = TRUE), 
xlab="Dimensions", ylab="RMSE",scales=list(ylim=c(0,1)))
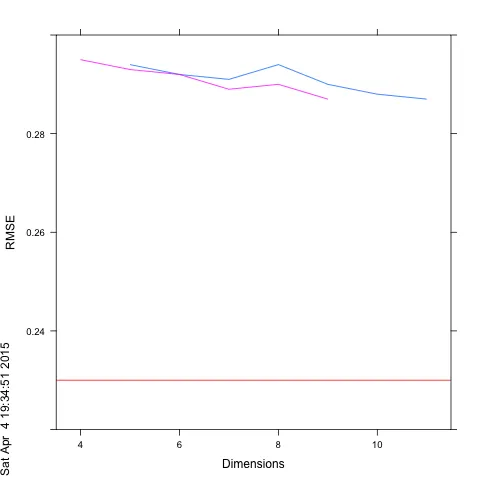
我希望在这张图上绘制一条横线,位于y轴0.23处,并使用不同的颜色。添加水平线的目的是显示基准线。这个可行吗?
我使用的样本数据如下:
Dim_Reduction, Dimensions, Time, RMSE
PCA, 9, 15.39, 0.287
PCA, 8, 16.84, 0.290
PCA, 7, 14.13, 0.289
PCA, 6, 12.14, 0.292
PCA, 5, 12.54, 0.293
PCA, 4, 11.23, 0.295
ICA, 11, 20.23, 0.287
ICA, 10, 20.88, 0.288
ICA, 9, 16.34, 0.290
ICA, 8, 16.99, 0.294
ICA, 7, 14.34, 0.291
ICA, 6, 13.33, 0.292
ICA, 5, 12.12, 0.294

2个回答

5
需要阅读'scales'中的?xyplot部分和'llines'的说明:
mylattice <- xyplot(RMSE ~ Dimensions, data=afterdim, groups = Dim_Reduction,
            panel =function(x,y,groups,...){ 
                           panel.xyplot(x,y,groups,...);
                           panel.lines(x=3:12, y=rep(0.23,10), col="red") },
             scales=list( y=list( limits= c(0.22,0.3))),
             type = "l", xlab="Dimensions", ylab="RMSE")
 png(); print(mylattice); dev.off()

enter image description here


看了这个很棒的例子,我终于明白了面板和xy图。谢谢! - Pablo Adames
我刚掌握了格点/格子图形的工作知识,就遇到了ggplot,于是我又迷失了。至今我在gg-verse方面大多数时候还是一头雾水。 - IRTFM

3
你可以尝试以下代码。
# data
afterdim <- read.table(header = TRUE, text = "
Dim_Reduction  Dimensions  Time RMSE
PCA, 9, 15.39, 0.287
PCA, 8, 16.84, 0.290
PCA, 7, 14.13, 0.289
PCA, 6, 12.14, 0.292
PCA, 5, 12.54, 0.293
PCA, 4, 11.23, 0.295
ICA, 11, 20.23, 0.287
ICA, 10, 20.88, 0.288
ICA, 9, 16.34, 0.290
ICA, 8, 16.99, 0.294
ICA, 7, 14.34, 0.291
ICA, 6, 13.33, 0.292
ICA, 5, 12.12, 0.294")

xyplot(RMSE ~ Dimensions, data=afterdim,groups =  Dim_Reduction,
       type = c("l", "g"), auto.key =list(spline = "bottom", points = FALSE, lines = TRUE), 
       xlab="Dimensions", ylab="RMSE",scales=list(ylim=c(0,1)),
       panel=function(...) {
           panel.xyplot(...)
           panel.abline(h=.29)
       })

太好了,这个有效。但是当我将它放在0.23上时,该线不会显示,因为Y轴没有覆盖它。有没有办法移动Y轴,以便该点能够显示? - birdy
你可以使用@BondedDust的解决方案,其中scales = list(y=list(limits=c(0.22,0.3)))或者将其替换为ylim = c(0.22, 0.3) - Mamoun Benghezal

网页内容由stack overflow 提供, 点击上面的
可以查看英文原文,
原文链接