我正在使用
我设置了
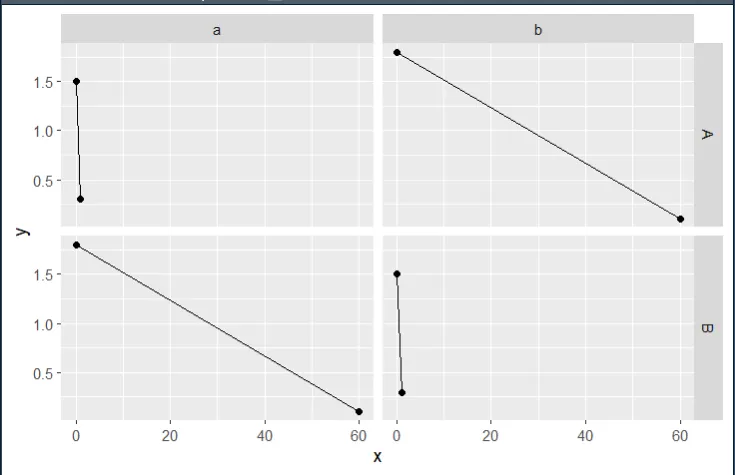
facet_grid() 画多个图。我设置了
scales = 'free',但对于 facet_1 = 'A',facet_2 = 'a' 和 facet_1 = 'b',facet_2 = 'B'(左上和右下的图)没有起作用。
x轴范围对于这两个图来说太大了。
df = data.frame(
  x = c(0, 1, 0, 1, 0, 60, 0, 60),
  y = c(1.5, 0.3, 1.5, 0.3, 1.8, 0.1, 1.8, 0.1),
  facet_1 = c('A', 'A', 'B', 'B', 'A', 'A', 'B', 'B'),
  facet_2 = c('a', 'a', 'b', 'b', 'b', 'b', 'a', 'a'))


df %>%
  ggplot(aes(x = x, y = y)) +
  geom_point() +
  geom_line() +
  facet_grid(facet_1~facet_2, scales = 'free', space = 'free') # scales = 'free_x' also doesn't work
patchwork重新绘制。df1 = df %>% filter(facet_1 == 'A',facet_2 == 'a')
df2 = df %>% filter(facet_1 == 'A',facet_2 == 'b')
df3 = df %>% filter(facet_1 == 'B',facet_2 == 'a')
df4 = df %>% filter(facet_1 == 'B',facet_2 == 'b')
p1 = df1 %>% ggplot(aes(x = x, y = y)) + geom_point() + geom_line()
p2 = df2 %>% ggplot(aes(x = x, y = y)) + geom_point() + geom_line()
p3 = df3 %>% ggplot(aes(x = x, y = y)) + geom_point() + geom_line()
p4 = df4 %>% ggplot(aes(x = x, y = y)) + geom_point() + geom_line()
library(patchwork)
p1+p2+p3+p4
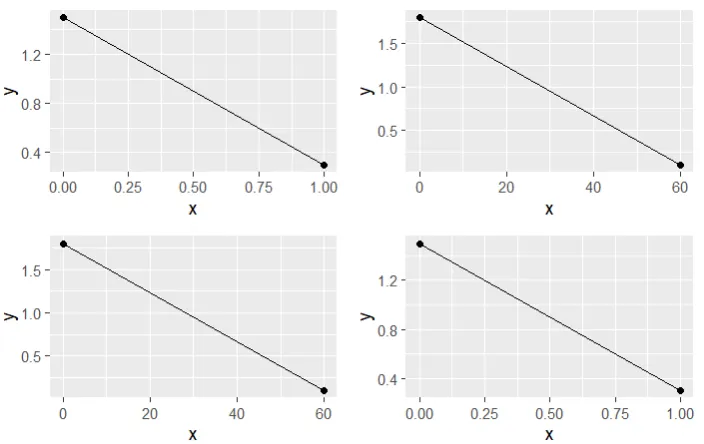
facet_grid()在ggplot中绘制像使用patchwork一样的图形?
facet_grid()能做到这个吗? - zhiwei lifacet_grid的一个前提条件是,同一列中的所有小图共享相同的 x 轴,而同一行中的所有小图共享相同的 y 轴。 - r2evans