我刚刚创建了一个非常简单的geopandas示例(请参见下文)。它可以工作,但我注意到对我来说很重要的是能够拥有自定义的世界部分。有时是德国,有时只有柏林。(另外,我想按我在geopandas文件中定义为多边形的区域聚合我拥有的数据,但我会在另一个问题中添加这个。)
我如何获得与以下不同的“底图”
world = gpd.read_file(gpd.datasets.get_path('naturalearth_lowres'))
用于可视化吗?
示例
# 3rd party modules
import pandas as pd
import geopandas as gpd
import shapely
# needs 'descartes'
import matplotlib.pyplot as plt
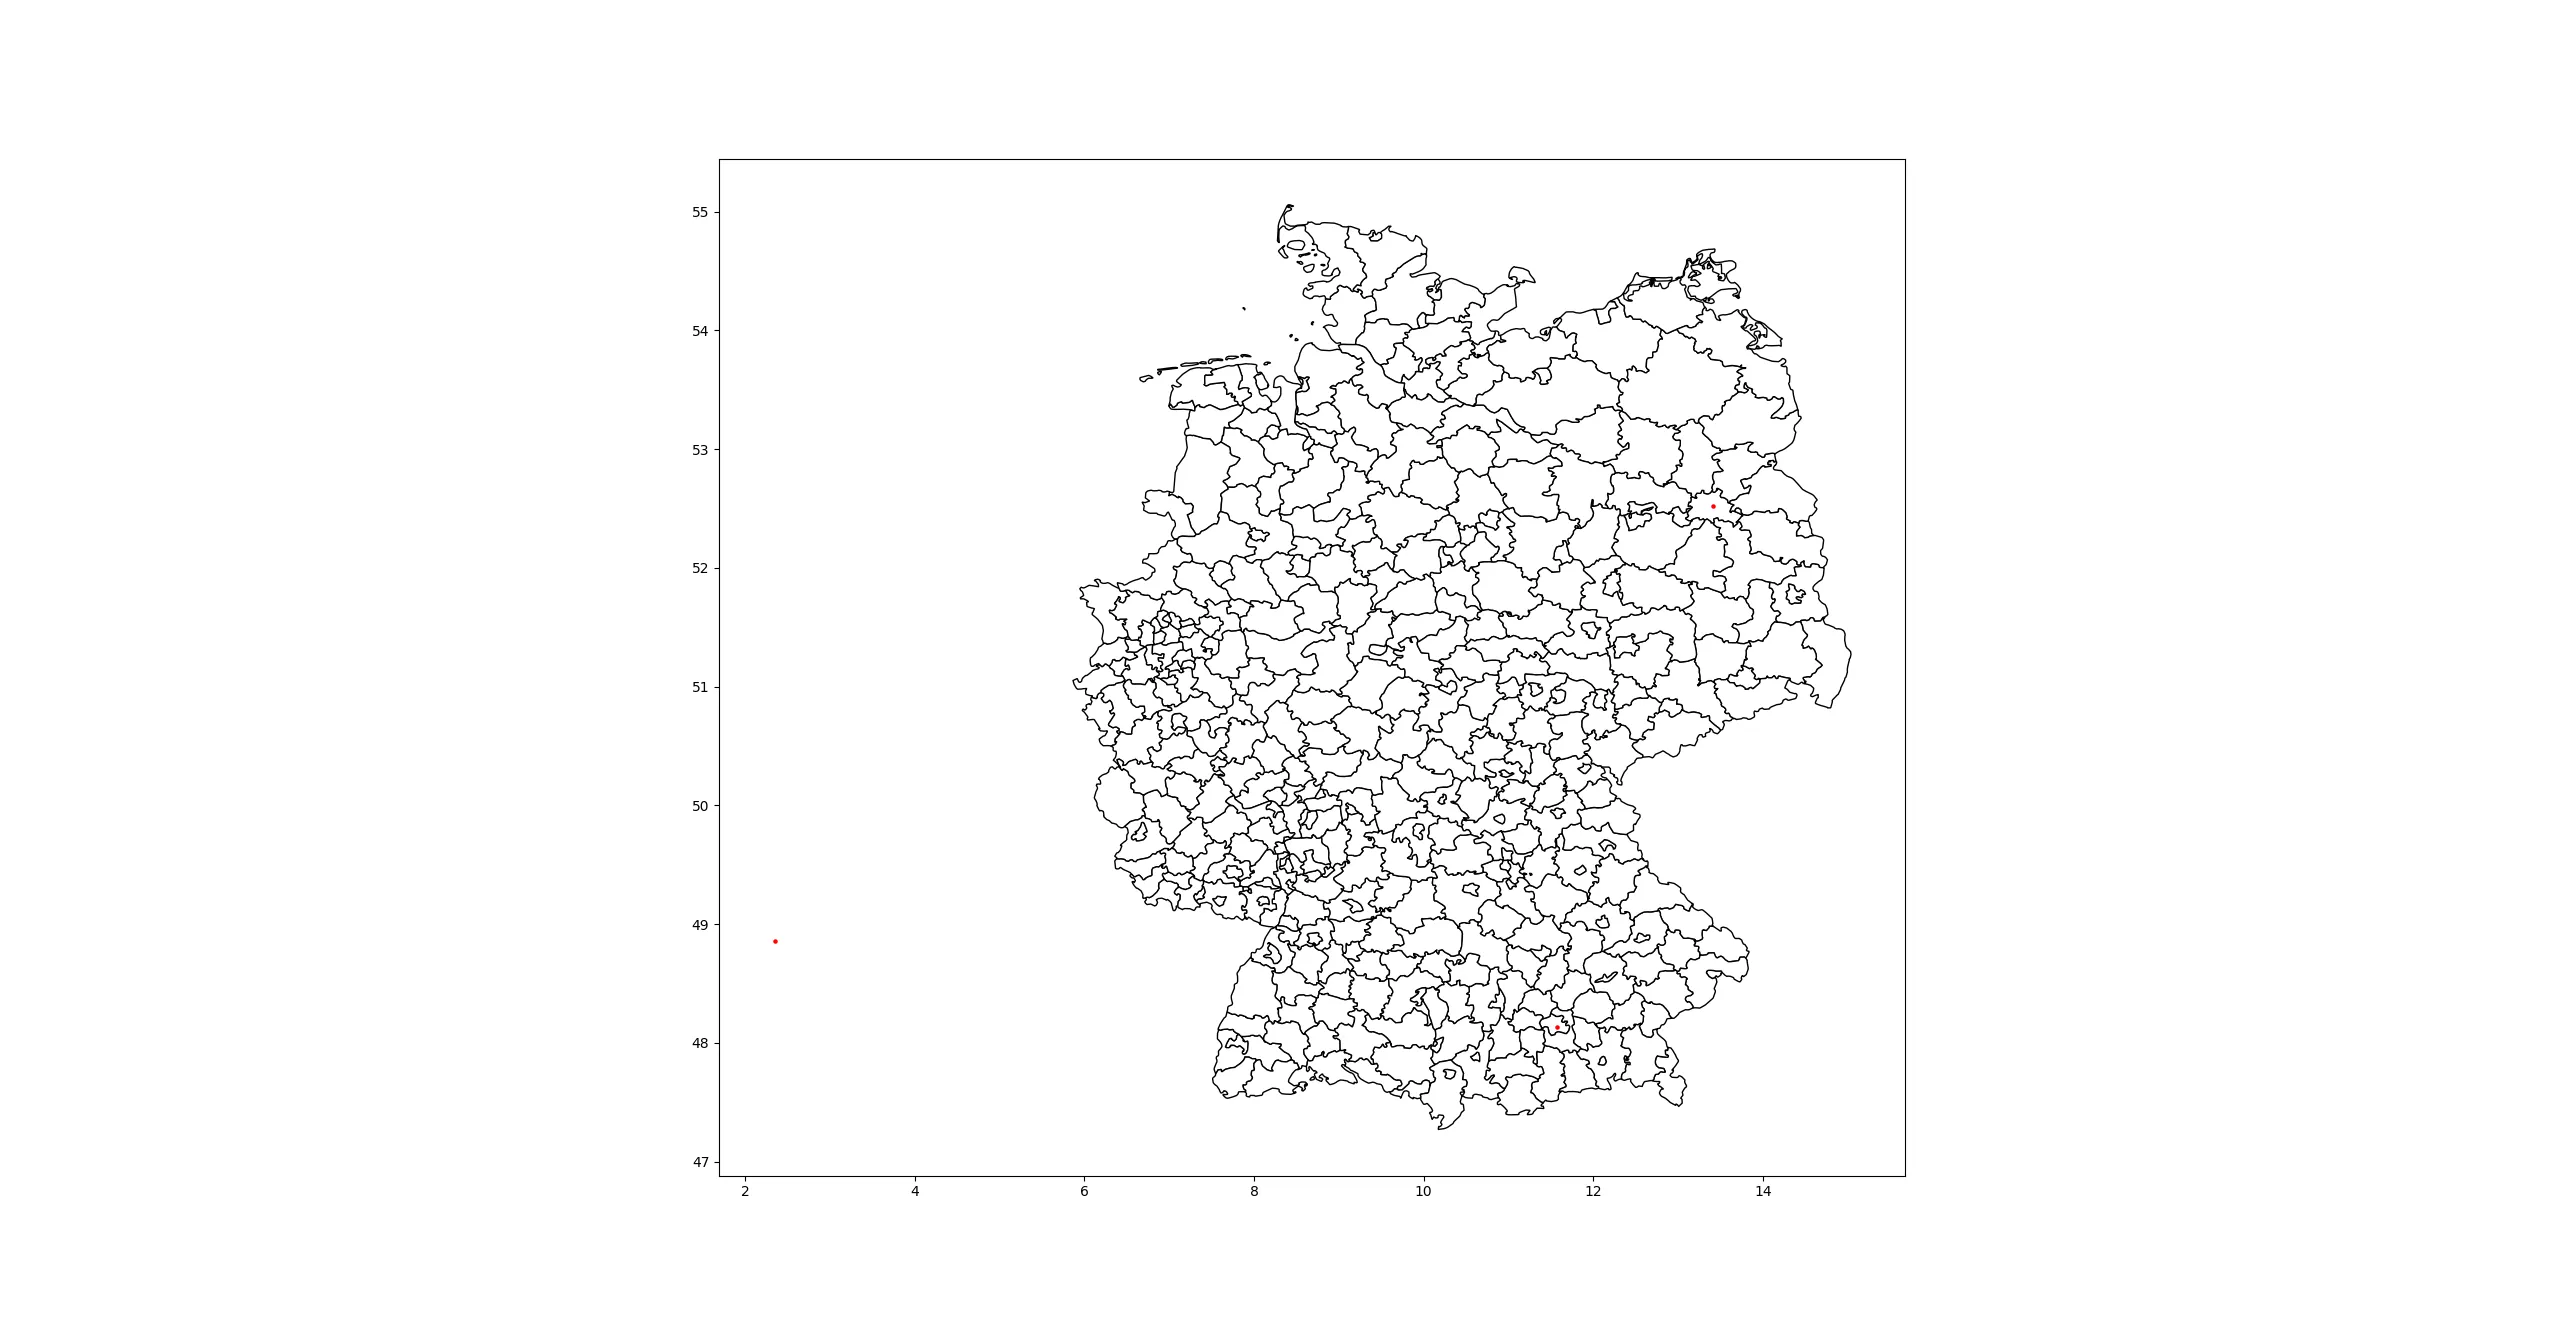
df = pd.DataFrame({'city': ['Berlin', 'Paris', 'Munich'],
'latitude': [52.518611111111, 48.856666666667, 48.137222222222],
'longitude': [13.408333333333, 2.3516666666667, 11.575555555556]})
gdf = gpd.GeoDataFrame(df.drop(['latitude', 'longitude'], axis=1),
crs={'init': 'epsg:4326'},
geometry=[shapely.geometry.Point(xy)
for xy in zip(df.longitude, df.latitude)])
print(gdf)
world = gpd.read_file(gpd.datasets.get_path('naturalearth_lowres'))
base = world.plot(color='white', edgecolor='black')
gdf.plot(ax=base, marker='o', color='red', markersize=5)
plt.show()