无法将参数传递给自定义函数中的ggplot

3
我想创建一个用户定义的函数,将其包装在我找到的一些流行的ggplot代码周围。我遇到了以下错误:
"Error in `[.data.frame`(DS, , xvar) : object 'xcol' not found" 

以下是一个小的伪数据集,用于说明该问题。
n=25
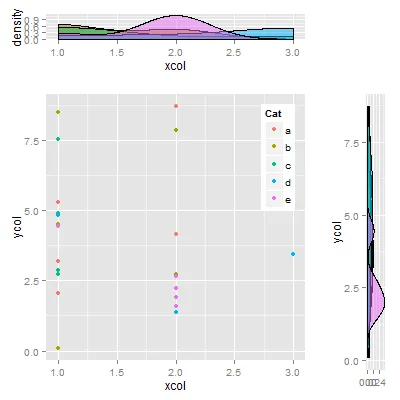
dataTest <- data.frame(xcol=sample(1:3, n, replace=TRUE), ycol = rnorm(n, 5, 2), Cat=letters[1:5])

用户定义的代码如下所示:
  TRIPLOT <- function (DS,xvar,yvar,zvar) {
 #localenv<-environment()
  gg <- data.frame(x=DS[,xvar],y=DS[,yvar],fill=DS[,zvar])
  empty<-ggplot()+geom_point(aes(1,1),colour="white") + theme( 
    plot.background = element_blank(),
    panel.background = element_blank(),
    panel.grid.minor = element_blank(),
    panel.border = element_blank(),
    panel.background = element_blank(),
    axis.title.x = element_blank(),
    axis.title.y = element_blank(),
    axis.text.x = element_blank(),
    axis.text.y = element_blank(),
    axis.ticks = element_blank())
  scatter <-ggplot(gg, aes_string(x=xvar,y=yvar), environment=environment())+
    geom_point(aes_string(color=zvar))+
    scale_color_manual(values=c("orange","purple"))+
    theme(legend.position=c(1,1), legend.justification=c(1,1))
  plot_top <- ggplot(gg,aes_string(x=xvar, fill=zvar), environment=environment())+geom_density(alpha=.5)+scale_fill_manual(values=c("orange","purple"))+theme(legend.position="none")
  plot_right <- ggplot(gg, aes_string(yvar, fill=zvar),environment=environment())+geom_density(alpha=.5)+coord_flip()+ scale_fill_manual(values=c("orange","purple"))+
    theme(legend.position="none", axis.title.x=element_blank())
  PLT <- grid.arrange(plot_top,empty,scatter,plot_right, ncol=2,nrow=2,widths=c(4,1), heights=c(1,4))
  print(PLT)
}

我将尝试运行的函数如下:

TRIPLOT(dataTest,"xcol","ycol","Cat")

我按照帖子的建议添加了环境参数和data.frame()参数。我也已经将这些参数用引号传递给函数。 感谢您的任何帮助。


尝试使用aes代替aes_string - Sandy Muspratt
嗨 Sandy。抱歉我刚看到你的评论。我先尝试了 aes,但当 aes 无法工作时,我切换到了 aes_string。不过还是谢谢你。 - RayR
抱歉,我没有仔细阅读你的代码。我已经添加了一个答案。 - Sandy Muspratt
感谢Sandy的快速回复。我无法为您的答案投票。我猜我没有足够的声望点数。 - RayR
请不要在这种布局中使用 grid.arrange,因为轴通常不会对齐。这里有一些帖子介绍了使用 gtable 实现此目的的方法。 - baptiste
1个回答

5

要将变量名称作为字符串传递给函数,或者重命名gg数据框中的变量名称;然后使用aes代替aes_string;并在调用ggplot时使用gg数据框及其变量名称。

或将变量名称作为字符串传递给函数;然后使用aes_string(跳过gg数据框)。

此外,scale_fill_manual中颜色数量存在问题。我已将这些行注释掉。

library(gridExtra)
library(ggplot2)

n=25
dataTest = data.frame(
   xcol=sample(1:3, n, replace=TRUE), 
   ycol = rnorm(n, 5, 2), 
   Cat=letters[1:5])

要么:

 TRIPLOT <- function (DS,xvar,yvar,zvar) {
 #localenv<-environment()
  gg <- data.frame(x = DS[,xvar], y = DS[, yvar],fill = DS[,zvar])
  empty<-ggplot()+geom_point(aes(1,1),colour="white") + theme( 
    plot.background = element_blank(),
    panel.background = element_blank(),
    panel.grid.minor = element_blank(),
    panel.border = element_blank(),
    panel.background = element_blank(),
    axis.title.x = element_blank(),
    axis.title.y = element_blank(),
    axis.text.x = element_blank(),
    axis.text.y = element_blank(),
    axis.ticks = element_blank())

  scatter <-ggplot(gg, aes(x = x,y = y))+
    geom_point(aes(color = fill))+
    #scale_color_manual(values=c("orange","purple"))+
    theme(legend.position=c(1,1), legend.justification=c(1,1))

  plot_top <-ggplot(gg,aes(x = x, fill = fill))+
   geom_density(alpha=.5)+
   #scale_fill_manual(values=c("orange","purple"))+
    theme(legend.position="none")

  plot_right <-ggplot(gg, aes(x = y, fill = fill))+
       geom_density(alpha=.5)+coord_flip()+ 
       #scale_fill_manual(values=c("orange","purple"))+
    theme(legend.position="none", axis.title.x=element_blank())

  PLT<-grid.arrange(plot_top,empty,scatter,plot_right, ncol=2,nrow=2,widths=c(4,1), heights=c(1,4))
  print(PLT)
}

TRIPLOT(dataTest,"xcol","ycol","Cat")

或者:

 TRIPLOT <- function (DS,xvar,yvar,zvar) {
 #localenv<-environment()
  #gg <- data.frame(x = DS[,xvar], y = DS[, yvar],fill = DS[,zvar])
  empty<-ggplot()+geom_point(aes(1,1),colour="white") + theme( 
    plot.background = element_blank(),
    panel.background = element_blank(),
    panel.grid.minor = element_blank(),
    panel.border = element_blank(),
    panel.background = element_blank(),
    axis.title.x = element_blank(),
    axis.title.y = element_blank(),
    axis.text.x = element_blank(),
    axis.text.y = element_blank(),
    axis.ticks = element_blank())

  scatter <-ggplot(DS, aes_string(x = xvar,y = yvar))+
    geom_point(aes_string(color = zvar))+
    #scale_color_manual(values=c("orange","purple"))+
    theme(legend.position=c(1,1), legend.justification=c(1,1))

  plot_top <-ggplot(DS,aes_string(x = xvar, fill = zvar))+
   geom_density(alpha=.5)+
   #scale_fill_manual(values=c("orange","purple"))+
    theme(legend.position="none")

  plot_right <-ggplot(DS, aes_string(x = yvar, fill = zvar))+
       geom_density(alpha=.5)+coord_flip()+ 
       #scale_fill_manual(values=c("orange","purple"))+
    theme(legend.position="none", axis.title.x=element_blank())

  PLT<-grid.arrange(plot_top,empty,scatter,plot_right, ncol=2,nrow=2,widths=c(4,1), heights=c(1,4))
  print(PLT)
}

TRIPLOT(dataTest,"xcol","ycol","Cat")

enter image description here


“theme(plot.background = element_blank(), panel.background = element_blank()” 中出现错误,移除 “plot.background = element_blank()” 可以解决该错误。 - PatrickT

网页内容由stack overflow 提供, 点击上面的
可以查看英文原文,
原文链接