我想使用一种不同的色调为美国地图上的每个州涂色。是否可以使用Python的Basemap完成此操作?
1个回答
25
在Basemap的GitHub存储库中有一个格式良好的示例:fillstates.py。形状文件(dbf | shp | shx)也包含在示例文件夹中。
以下是该示例的简化版本:
import matplotlib.pyplot as plt
from mpl_toolkits.basemap import Basemap
from matplotlib.patches import Polygon
# create the map
map = Basemap(llcrnrlon=-119,llcrnrlat=22,urcrnrlon=-64,urcrnrlat=49,
projection='lcc',lat_1=33,lat_2=45,lon_0=-95)
# load the shapefile, use the name 'states'
map.readshapefile('st99_d00', name='states', drawbounds=True)
# collect the state names from the shapefile attributes so we can
# look up the shape obect for a state by it's name
state_names = []
for shape_dict in map.states_info:
state_names.append(shape_dict['NAME'])
ax = plt.gca() # get current axes instance
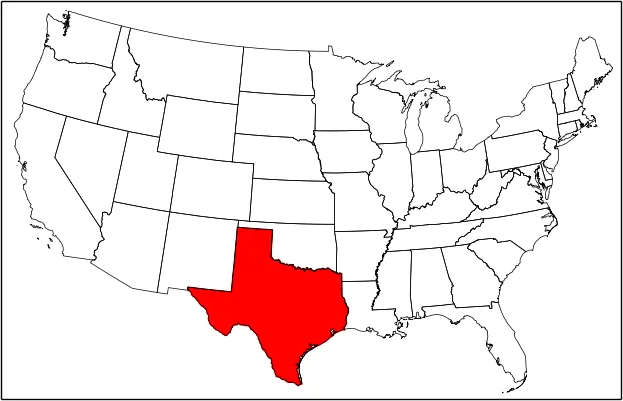
# get Texas and draw the filled polygon
seg = map.states[state_names.index('Texas')]
poly = Polygon(seg, facecolor='red',edgecolor='red')
ax.add_patch(poly)
plt.show()
用红色填充德克萨斯州的结果图:
请注意,当我们加载一个shapefile时,形状和属性分别存储在map.states和map.states_info中,这是基于readshapefile调用中使用的name参数而形成的列表。因此,要查找特定州的形状,我们必须建立相应的州名称列表,该列表从属性中获取。
- Weston
4
网页内容由stack overflow 提供, 点击上面的可以查看英文原文,
原文链接
原文链接
*是起始标记。 - Weston