我将使用WPF工具包(http://www.codeproject.com/Articles/196502/WPF-Toolkit-Charting-Controls-Line-Bar-Area-Pie-Co)创建一条折线图。
以下是我的操作步骤:
以下是我的操作步骤:
<Window x:Class="TempDataAnalyzer.MainWindow"
xmlns="http://schemas.microsoft.com/winfx/2006/xaml/presentation"
xmlns:x="http://schemas.microsoft.com/winfx/2006/xaml"
Title="MainWindow" Height="350" Width="525" xmlns:chartingToolkit="clr-namespace:System.Windows.Controls.DataVisualization.Charting;assembly=System.Windows.Controls.DataVisualization.Toolkit" Loaded="Window_Loaded">
<Grid>
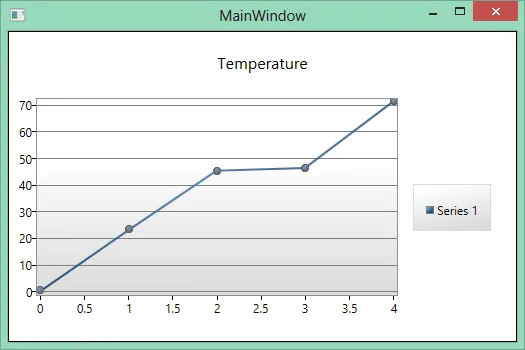
<chartingToolkit:Chart Name="lineChart" Title="Temperature" VerticalAlignment="Stretch" HorizontalAlignment="Stretch">
<chartingToolkit:LineSeries DependentValuePath="Value" IndependentValuePath="Key" ItemsSource="{Binding}" IsSelectionEnabled="True"/>
</chartingToolkit:Chart>
</Grid>
</Window>
C#:
public partial class MainWindow : Window
{
    public MainWindow()
    {
        InitializeComponent();
    }

    private void Window_Loaded(object sender, RoutedEventArgs e)
    {
        List<KeyValuePair<int, int>> entries = new List<KeyValuePair<int, int>>();
        entries.Add(new KeyValuePair<int, int>(0, 0));
        entries.Add(new KeyValuePair<int, int>(1, 23));
        entries.Add(new KeyValuePair<int, int>(2, 45));
        entries.Add(new KeyValuePair<int, int>(3, 46));
        entries.Add(new KeyValuePair<int, int>(4, 71));

        lineChart.DataContext = entries;
    }

}
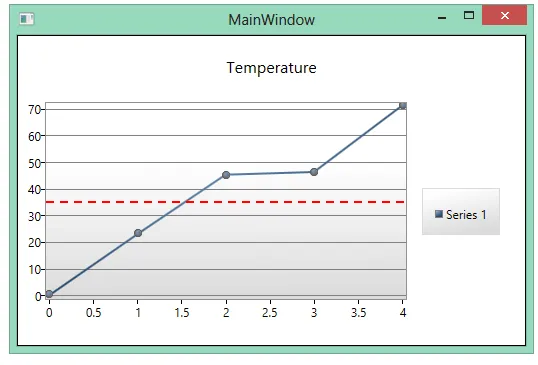
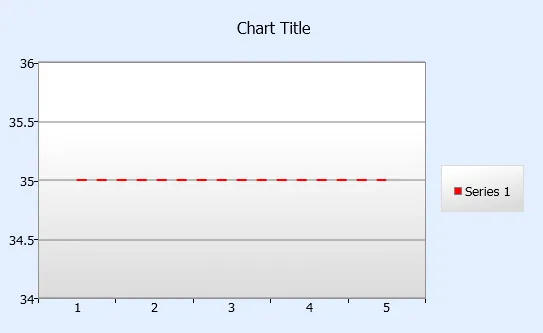
我该怎么做才能实现这个?