我使用ggplot2绘制我的数据,出现了错误提示"prediction from a rank-deficient fit may be misleading"。请看这里:
# Data.
temp <- structure(list(x = c(-62135599651, -62135599057, -62135598463, -62135597869, -62135597275, -62135596681, -62135596087, -62135595493, -62135594899, -62135594305), y = c(0.1, 0.2, 0.4, 0.3, 0.5, 0.5, 0.9, 0.9, 0.8, 1)), class = "data.frame", row.names = c(NA, -10L))
# Plot.
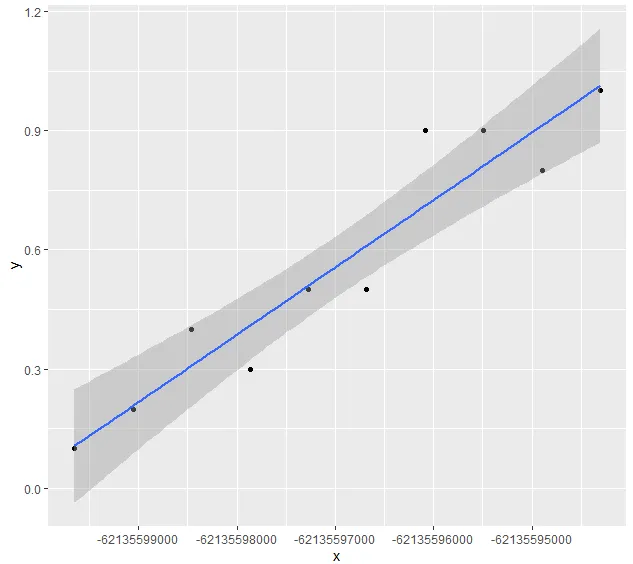
ggplot(temp, aes(x, y)) +
geom_point() +
geom_smooth(method= "lm")
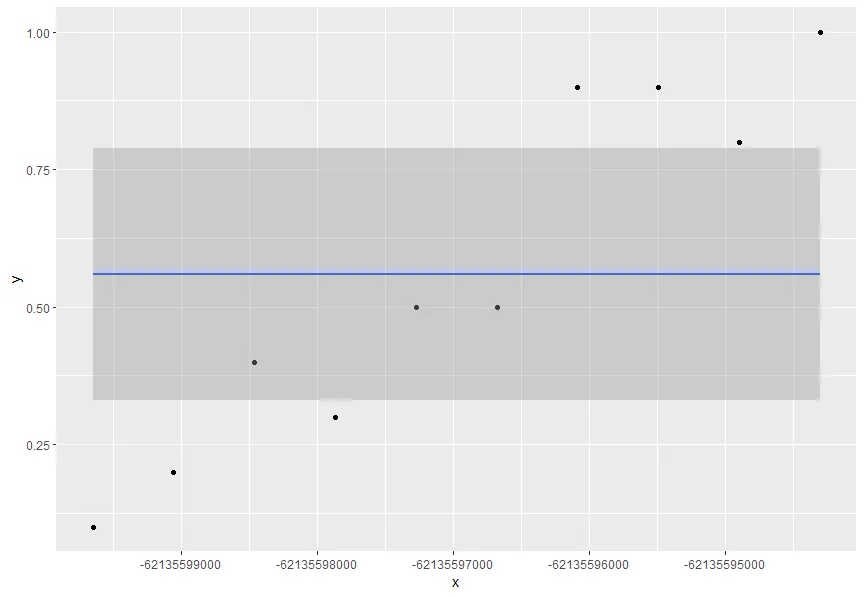
在这张图中,geom_smooth()线看起来不对(正如错误信息所提示的):
有一个类似的问题,但缺少可重现的示例且没有答案。我应该怎么做呢?
编辑
对于那些想要进一步了解如何在统计上解决此问题的人,请参见我在此处的问题。