ggplot指定经度/纬度轴断点

4
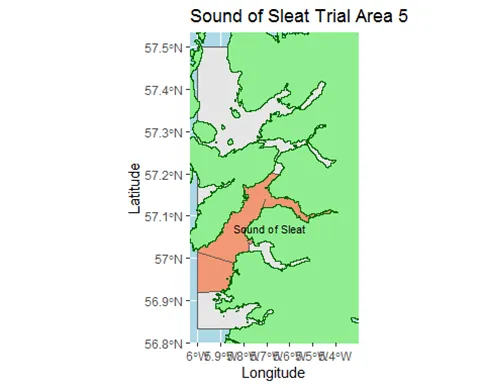
我正在使用以下代码从一个shapefile中创建“trial_area”的地图,并覆盖来自第二个shapefile的海岸线和“prod_areas”区域。然后我使用coord_sf将地图缩放到trial_area多边形的st_bbox。但是对于某些区域(请参见下面的示例),轴刻度文本标签会重叠,是否有一种方式可以指定轴刻度标记间隔以避免这种情况(例如纬度为.1,经度为.5)?
poly <- trial_areas %>% 
filter(Id==5) 
ext <- st_bbox(poly)

plot_SoundOfSleat <- ggplot() +
theme(panel.background = element_rect(fill = 'light blue'),element_line()) +
geom_sf(data=poly)+
geom_sf(data=prod_areas,fill=mycol) +
geom_sf(data = Scot, aes(),
        fill = "lightgreen",col="darkgreen") +
coord_sf(xlim = c(ext[1], ext[3]), ylim = c(ext[2], ext[4]))  +
ggtitle("Sound of Sleat Trial Area 5") +
geom_sf_text(aes(label = Producti_1), data=prod_areas,size=3,hjust=0, vjust=0) +
labs(x = "Longitude", y= "Latitude")

plot_SoundOfSleat

enter image description here

1个回答

6

geom_sf()应该与ggplot2::scale_*_continuous()无缝配合,您可以使用breaks =参数。请注意西经度,因为它们在数据中是负数,但在标签中是正数。

下面我列举了一些例子:

library(sf)

# sample data
nc <-  st_read(system.file("shape/nc.shp", package="sf"))

# No edits to graticules
nc_1 <- ggplot(nc) + 
          geom_sf() +
          ggtitle('original')

nc_2 <- ggplot(nc) +
          geom_sf() + 
          scale_y_continuous(breaks = c(34, 35, 36)) + 
          scale_x_continuous(breaks = seq(-84, -76, by = 1)) +
          ggtitle('fewer lat, more lon')

nc_3 <- ggplot(nc) +
          geom_sf(data = st_graticule(nc, 
                                      lat = seq(34, 36, by = 1),
                                      lon = seq(-84, -76, by = 4)), 
                  color = 'orange') +
          geom_sf() +
          coord_sf(datum = NA) +
          ggtitle('using st_graticule')

# using cowplot to output single image, rather than 3
cowplot::plot_grid(nc_1, nc_2, nc_3, ncol = 1)

enter image description here

你应该能够使用st_bbox的输出来自动化生成必要的经纬网格线(graticules)。

网页内容由stack overflow 提供, 点击上面的
可以查看英文原文,
原文链接