我从这个问题中学到了如何在
matplotlib中更改数学文本的默认大小Matplotlib: 更改数学字体大小。我的做法是:from matplotlib import rcParams
rcParams['mathtext.default'] = 'regular'
这实际上使LaTeX字体与常规字体大小相同。
我不知道如何将其重置为默认行为,即:LaTeX字体看起来比常规字体小一点。
我需要这样做是因为我希望LaTeX字体在一个图中的外观与常规字体相同,而不是在使用LaTex数学格式的所有图中都相同。
这是我创建图的MWE:
import matplotlib.pyplot as plt
import numpy as np
import matplotlib.gridspec as gridspec
# Generate random data.
x = np.random.randn(60)
y = np.random.randn(60)
fig = plt.figure(figsize=(5, 10)) # create the top-level container
gs = gridspec.GridSpec(6, 4) # create a GridSpec object
ax0 = plt.subplot(gs[0:2, 0:4])
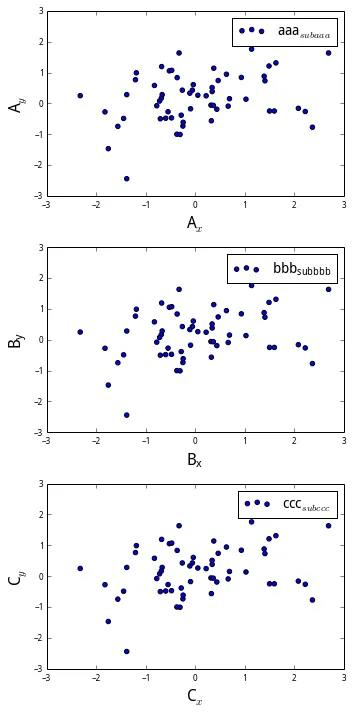
plt.scatter(x, y, s=20, label='aaa$_{subaaa}$')
handles, labels = ax0.get_legend_handles_labels()
ax0.legend(handles, labels, loc='upper right', numpoints=1, fontsize=14)
plt.ylabel('A$_y$', fontsize=16)
plt.xlabel('A$_x$', fontsize=16)
ax1 = plt.subplot(gs[2:4, 0:4])
# I want equal sized LaTeX fonts only on this plot.
from matplotlib import rcParams
rcParams['mathtext.default'] = 'regular'
plt.scatter(x, y, s=20, label='bbb$_{subbbb}$')
handles, labels = ax1.get_legend_handles_labels()
ax1.legend(handles, labels, loc='upper right', numpoints=1, fontsize=14)
plt.ylabel('B$_y$', fontsize=16)
plt.xlabel('B$_x$', fontsize=16)
# If I set either option below the line that sets the LaTeX font as 'regular'
# is overruled in the entire plot.
#rcParams['mathtext.default'] = 'it'
#plt.rcdefaults()
ax2 = plt.subplot(gs[4:6, 0:4])
plt.scatter(x, y, s=20, label='ccc$_{subccc}$')
handles, labels = ax2.get_legend_handles_labels()
ax2.legend(handles, labels, loc='upper right', numpoints=1, fontsize=14)
plt.ylabel('C$_y$', fontsize=16)
plt.xlabel('C$_x$', fontsize=16)
fig.tight_layout()
out_png = 'test_fig.png'
plt.savefig(out_png, dpi=150)
plt.close()
rcParams重置为默认值吗?如果是的话,请使用plt.rcdefaults()。 - Joe Kingtonit放回去。 - Aungr'$\mathregular{your_expression_here}$'即可。 - Joe Kingtonplt.rcdefaults()和设置rcParams['mathtext.default'] = 'it',但这两种方法都会给我带来相同的问题:它们要么影响整个图形,要么根本不起作用。让我提供一个更详细的示例来让大家更清楚地了解我的图形设置。 - GabrielMWE。请注意,我只想覆盖中间图的默认行为,而不是其他图的行为。 - Gabriel