在how-do-i-access-the-stackoverflow-api-from-mathematica中,我概述了如何使用SO API让Mathematica生成一些有趣的最佳答案者声望图。这个API是否也可以用来提供一些侵犯隐私的洞察力,了解答题者的夜间习惯?
我可以使用Stackoverflow API查询哪些SO回答者睡眠不足吗?
15
- Sjoerd C. de Vries
4
仅限于您知道(并信任)其位置的用户。 - R. Martinho Fernandes
1...以及他们目前的休息水平。:) 我不认为有一种API可以触碰到人的大脑,但我听说谷歌和苹果正在合作建立一个。 - jefflunt
哈哈哈,我的图表将会很特别。::咧嘴笑:: - Mr.Wizard
1@Mr.Wizard 看起来你每天只睡两个小时。我猜你的名字背后藏着一群作家。或者是 Mr.Wizard = Dr.Jekyll 和 Mr.Hyde? - Sjoerd C. de Vries
1个回答
13
当然,可以使用以下 MMA8 代码:
getActionDates[userID_Integer] :=
 Module[{total},
  total =
   "total" /.
    Import["http://api.stackoverflow.com/1.1/users/" <>
      ToString[userID] <> "/timeline?pagesize=1&page=1", "JSON"];
  DateList[# + AbsoluteTime["January 1, 1970"]] & /@ Join @@
    Table[
     "creation_date" /. ("user_timelines" /.
        Import["http://api.stackoverflow.com/1.1/users/" <>
          ToString[userID] <> "/timeline?pagesize=100&page=" <>
          ToString[p], "JSON"])
     , {p, Ceiling[total/100]}
     ]
  ]

makeWeekHistogram[userID_Integer] :=
 Module[{dates2Positions},
  dates2Positions =
   ToExpression[
       DateString[#, {"{", "DayNameShort", "+", "Hour", "+", "Minute",
          "/60./.{Sun->0,Mon->24,Tue->2*24,Wed->3*24,Thu->4*24,Fri->5*\
24,Sat->6*24}}"}]] & /@ getActionDates[userID] // Flatten;
  Histogram[dates2Positions, {1}, "Count",
   GridLines -> {Table[24 i, {i, 1, 6}], None},
   BaseStyle -> {FontFamily -> "Arial-Bold", FontSize -> 16},
   FrameTicks -> {{Automatic,
      None}, {{{12, "Sun"}, {24 + 12, "Mon"}, {2 24 + 12,
        "Tue"}, {3 24 + 12, "Wed"}, {4 24 + 12, "Thu"}, {5 24 + 12,
        "Fri"}, {6 24 + 12, "Sat"}}, None}},
   FrameLabel -> {"Day of week", "Number of actions",
     First["display_name" /. ("users" /.
         Import["http://api.stackoverflow.com/1.1/users/" <>
           ToString[userID], "JSON"])], ""}, Frame -> True,
   PlotRangePadding -> 0]
  ]

   makeDayHistogram[userID_Integer] :=
 Module[{dates2Positions},
  dates2Positions =
   ToExpression[DateString[#, {"Hour", "+", "Minute", "/60."}]] & /@
     getActionDates[userID] // Flatten;
  Histogram[dates2Positions, {1}, "Count",
   FrameTicks -> {{Automatic,
      None}, {Table[{i + 0.5, i}, {i, 0, 20, 5}], None}},
   BaseStyle -> {FontFamily -> "Arial-Bold", FontSize -> 16},
   FrameLabel -> {"Hour", "Number of actions",
     First["display_name" /. ("users" /.
         Import["http://api.stackoverflow.com/1.1/users/" <>
           ToString[userID], "JSON"])], ""}, Frame -> True,
   PlotRangePadding -> 0]
  ]
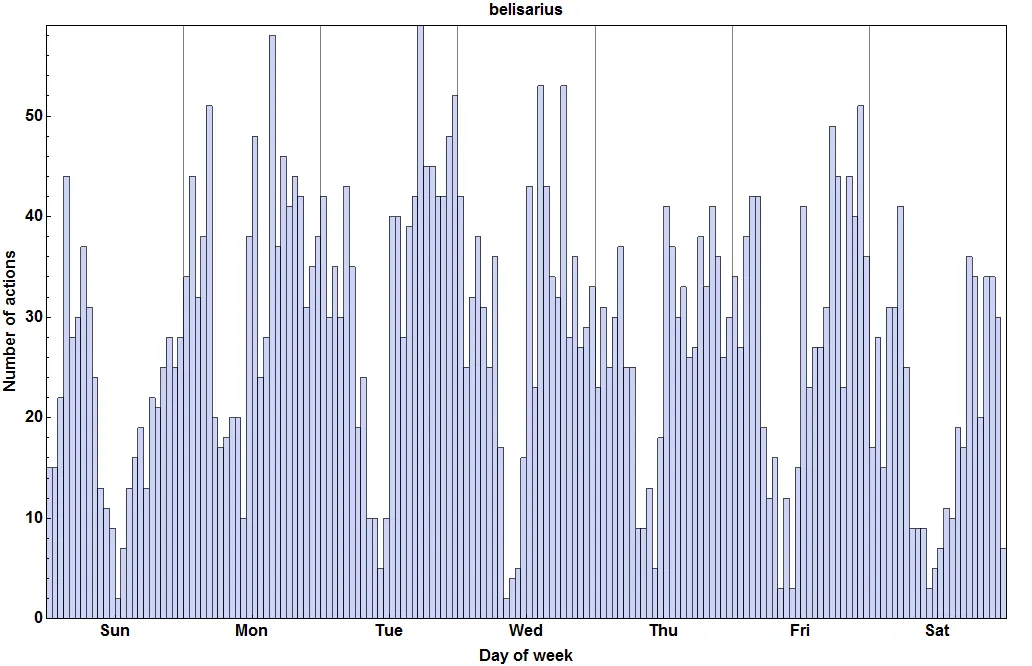
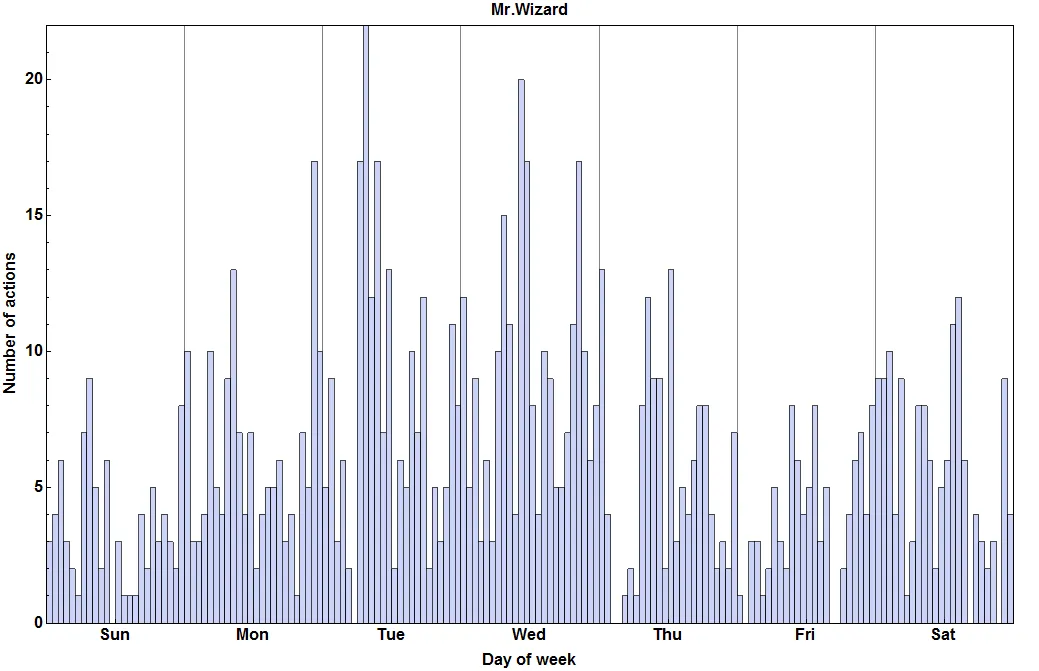
当然,我们只有服务器时间和日期,但这种模式应该能够说明一些本地化的问题,不是吗?尽管... Mr.Wizard... 你没什么生活!
makeWeekHistogram[353410]
编辑
Mr.Wizard请求的按小时统计图表:
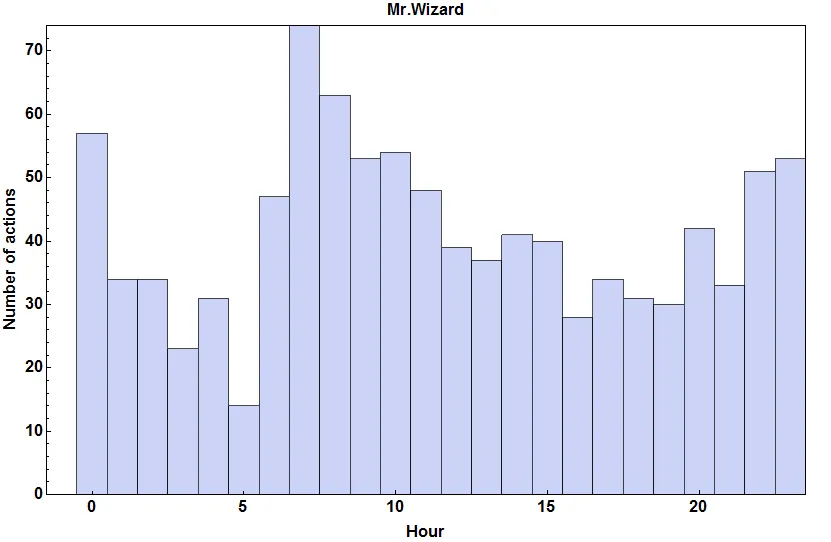
- Sjoerd C. de Vries
9
2你能给你的
y轴加上标签吗? - user616736我不会说Mathematica或SO API。你画了什么图?问题、回答和评论的创建和编辑计数吗? - R. Martinho Fernandes
3@Sjoerd:您能发布一个mma7版本让我来操作吗? - user616736
@Mr.Wizard 完成了。是的,你那句话激怒了我。无论如何,我现在要下线了。我的时区已经是凌晨3点了。 - Sjoerd C. de Vries
1@yoda 在 https://dev59.com/X2025IYBdhLWcg3w4aCu 中,我提供了一个基本的 MMA 7 导入 JSON 格式的方法。我现在要去睡觉了。 - Sjoerd C. de Vries
显示剩余4条评论
网页内容由stack overflow 提供, 点击上面的可以查看英文原文,
原文链接
原文链接
- 相关问题
- 3 如何在PHP中使用StackOverflow API V 2.2获取问题
- 6 StackOverflow搜索API
- 3 使用PHP Curl请求Stackoverflow API
- 8 使用StackOverflow API检索JSON
- 4 尝试访问stackoverflow api时遇到解析错误。
- 6 Stackoverflow API响应格式
- 4 如何调整查询Stackoverflow API时返回的结果数量?
- 11 使用Mathematica和StackOverflow API监视新的Mathematica问题
- 26 如何从Mathematica访问StackOverflow API
- 13 如何基于搜索查询从stackoverflow API获取问题列表?