我是RDFLIB在Python中的新手。我在这里找到了创建图形的示例。有什么最简单的方法可以可视化由此代码创建的图形吗?
import rdflib
# Now we create a graph, a representaiton of the ontology
g = rdflib.Graph()
# Now define the key words that we will use (the edge weights of the graph)
has_border_with = rdflib.URIRef('http://www.example.org/has_border_with')
located_in = rdflib.URIRef('http://www.example.org/located_in')
# define the things - base level objects that will be the nodes
# In this case first we have countries
germany = rdflib.URIRef('http://www.example.org/country1')
france = rdflib.URIRef('http://www.example.org/country2')
china = rdflib.URIRef('http://www.example.org/country3')
mongolia = rdflib.URIRef('http://www.example.org/country4')
# then we have continents
europa = rdflib.URIRef('http://www.example.org/part1')
asia = rdflib.URIRef('http://www.example.org/part2')
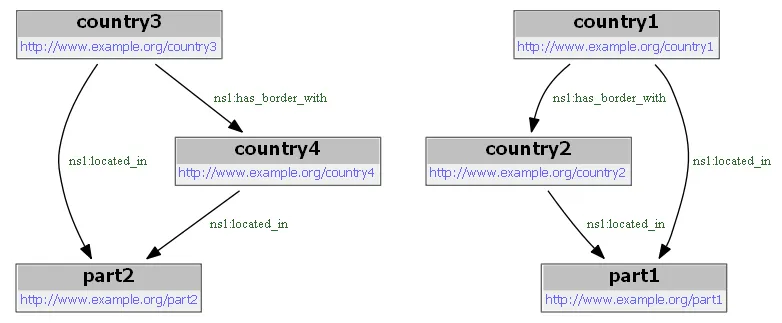
# Having defined the things and the edge weights, now assemble the graph
g.add((germany,has_border_with,france))
g.add((china,has_border_with,mongolia))
g.add((germany,located_in,europa))
g.add((france,located_in,europa))
g.add((china,located_in,asia))
g.add((mongolia,located_in,asia))
我看到rdflib包有一个工具组件,其中有一个名为rdfs2dot的函数。我如何使用该函数显示带有RDF图的绘图?
g.serialize("world.rdf"),然后将其转换为dot语法:rdfs2dot world.rdf > world.dot,然后使用任何允许绘制dot图形的工具。例如xdotxdot world.dot。由于某种原因,rdfs2dot生成了一个空图。根据Graph.serialize的文档,rdf应该是默认格式,因此这里可能存在一个错误或者rdfs2dot中存在一个错误。也许可以在github上查看开放的票据,或者发布一个新问题。 - Emilien