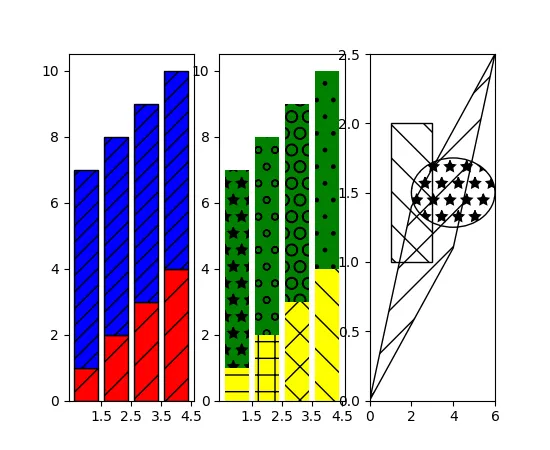
我想要制作既有阴影填充又有图案填充的直方图(就像这个matplotlib示例中左侧的条形图):
这是我尝试使用的代码:
import matplotlib.pyplot as plt
plt.hist(values, bins, histtype='step', linewidth=2, facecolor='c', hatch='/')
无论我指定"facecolor"还是"color",都只有阴影线的颜色显示出来,而直方图仍然没有填充。我该如何使阴影线显示在填充的直方图上面呢?
我想要制作既有阴影填充又有图案填充的直方图(就像这个matplotlib示例中左侧的条形图):
这是我尝试使用的代码:
import matplotlib.pyplot as plt
plt.hist(values, bins, histtype='step', linewidth=2, facecolor='c', hatch='/')
无论我指定"facecolor"还是"color",都只有阴影线的颜色显示出来,而直方图仍然没有填充。我该如何使阴影线显示在填充的直方图上面呢?
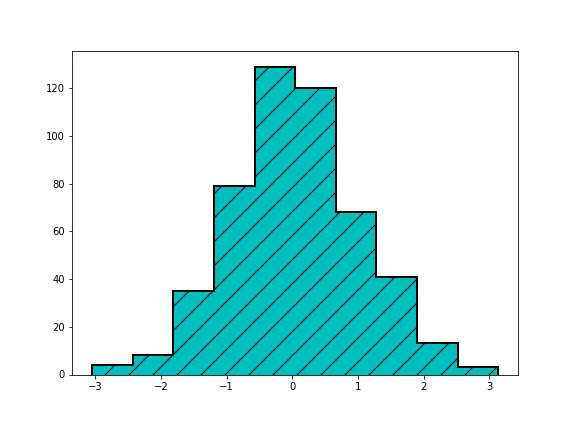
为了填充直方图下面的区域,可以将 kwarg fill 设置为 True。然后,可以设置 facecolor 和 edgecolor 以使用不同的颜色来绘制阴影和背景。
plt.hist(np.random.normal(size=500), bins=10, histtype='step', linewidth=2, facecolor='c',
         hatch='/', edgecolor='k',fill=True)
这将生成以下输出:
histtype='step'会绘制阶梯形线条。由于它们是线条,所以定义上它们不会被填充。
相反,使用histtype='bar'(这是默认值,您也可以完全省略它)。
histtype='stepfilled' 也可以解决问题。 - ylangylang