我正在尝试使用XLSX Writer进行条件格式设置,使用三色比例尺并将0中点值放在中间。 我希望所有负数从红色(最低数字)到黄色(当值为零时)进行缩放,而所有正数则从黄色(在零处)到绿色(在最高处)进行缩放。
当我尝试以下操作时,缩放会混乱。
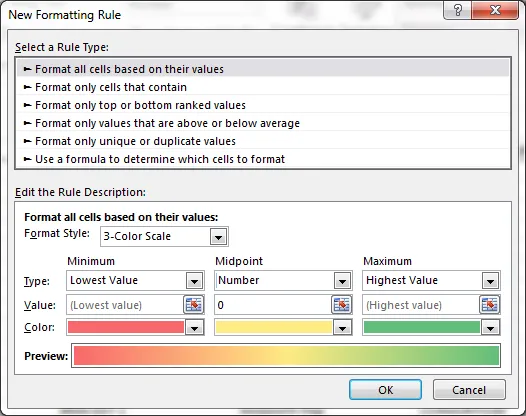
在Excel中,它看起来像以下内容:
当我尝试以下操作时,缩放会混乱。
在Excel中,它看起来像以下内容:
worksheet.conditional_format('G2:G83', {'type': '3_color_scale',
                                     'min_color': "red",
                                     'mid_color': "yellow",
                                     'max_color': "green"})
我接着尝试使用一个标准来区分数值大于零和小于零的情况
worksheet.conditional_format('G2:G83', {'type': '2_color_scale',
                                    'criteria': '<',
                                    'value': 0,
                                    'min_color': "red",
                                    'max_color': "yellow"})


worksheet.conditional_format('G2:G83', {'type': '2_color_scale',
                                    'criteria': '>',
                                    'value': 0,
                                     'min_color': "yellow",
                                     'max_color': "green"})
但似乎那也不起作用 - 如果有任何想法..请告诉我..非常感激。
完整的示例代码:
import xlsxwriter

workbook = xlsxwriter.Workbook('conditional_format.xlsx')
worksheet1 = workbook.add_worksheet()


# Add a format. Light red fill with dark red text.
format1 = workbook.add_format({'bg_color': '#FFC7CE',
                           'font_color': '#9C0006'})

# Add a format. Green fill with dark green text.
format2 = workbook.add_format({'bg_color': '#C6EFCE',
                           'font_color': '#006100'})

# Some sample data to run the conditional formatting against.
data = [
[34, 72, -38, 30, 75, 48, 75, 66, 84, 86],
[-6, -24, 1, -84, 54, 62, 60, 3, 26, 59],
[-28, 0, 0, 13, -85, 93, 93, 22, 5, 14],
[27, -71, -40, 17, 18, 79, 90, 93, 29, 47],
[0, 25, -33, -23, 0, 1, 59, 79, 47, 36],
[-24, 100, 20, 88, 29, 33, 38, 54, 54, 88],
[6, -57, -88, 0, 10, 26, 37, 7, 41, 48],
[-52, 78, 1, -96, 26, -45, 47, 33, 96, 36],
[60, -54, -81, 66, 81, 90, 80, 93, 12, 55],
[-70, 5, 46, 14, 71, -19, 66, 36, 41, 21],
]
for row, row_data in enumerate(data):
    worksheet1.write_row(row + 2, 1, row_data)


worksheet1.conditional_format('B2:B12', {'type': '2_color_scale',
                                    'criteria': '<',
                                    'value': 0,
                                    'min_color': "red",
                                    'max_color': "yellow"})


worksheet1.conditional_format('C2:C12', {'type': '2_color_scale',
                                    'criteria': '>',
                                    'value': 0,
                                     'min_color': "yellow",
                                     'max_color': "green"})

worksheet1.conditional_format('C2:C12', {'type': '2_color_scale',
                                    'criteria': '<',
                                    'value': 0,
                                     'min_color': "red",
                                     'max_color': "yellow"})


worksheet1.conditional_format('D2:D12', {'type': '3_color_scale',
                                     'min_color': "red",
                                     'mid_color': "yellow",
                                     'max_color': "green"})


workbook.close()
writer.save()
这就是我得到的:
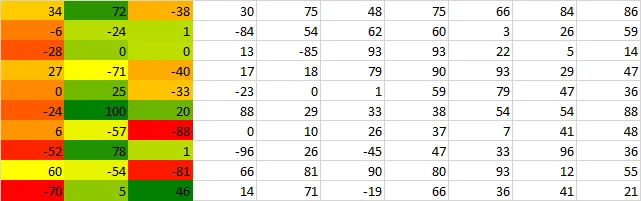
正如您所见,B列(第一列)没有绿色
C列没有红色
D列的值为0,表示绿色
有什么想法可以实现三步缩放并将零放在中间吗?
谢谢