我试图保留ggplot生成的图例,但应用plotly后图例消失了。这是我的代码:
ggplotchange <- ggplot(data = map.world1, aes(x = long, y = lat, group = group, fill = happiness, text  = paste("Country:", region, "<br>", "Happiness:", -happiness, "<br>", "Economy:", economy, "<br>", "Family:", family, "<br>", "Health:", -health, "<br>", "Freedom:", -freedom, "<br>", "Trust:", trust, "<br>", "Generosity:", generosity))) +
  geom_polygon() +
  scale_fill_gradientn(colors = ocean.curl(150)) +
  theme(
    panel.grid = element_blank(),
    axis.text = element_blank(),
    axis.title = element_blank(),
    axis.ticks = element_blank(),
    legend.title = element_blank(),
    plot.title = element_text(hjust = 0.5)) +
  labs(title = "Change from 2015 to 2022") +
  guides(fill = guide_legend(title=""))
ggplotly(ggplotchange, tooltip = c("text"))
地图world1数据的dput如下:
structure(list(long = c(-69.8991241455078, -69.8957061767578,
-69.9421920776367, -70.004150390625, -70.0661163330078, -70.0508804321289
), lat = c(12.4520015716553, 12.4229984283447, 12.4385251998901,
12.50048828125, 12.5469722747803, 12.5970697402954), group = c(1,
1, 1, 1, 1, 1), order = 1:6, region = c("Aruba", "Aruba", "Aruba",
"Aruba", "Aruba", "Aruba"), subregion = c(NA_character_, NA_character_,
NA_character_, NA_character_, NA_character_, NA_character_),
    region.y = c(NA_character_, NA_character_, NA_character_,
    NA_character_, NA_character_, NA_character_), happiness = c(NA_real_,
    NA_real_, NA_real_, NA_real_, NA_real_, NA_real_), economy = c(NA_real_,
    NA_real_, NA_real_, NA_real_, NA_real_, NA_real_), family = c(NA_real_,
    NA_real_, NA_real_, NA_real_, NA_real_, NA_real_), health = c(NA_real_,
    NA_real_, NA_real_, NA_real_, NA_real_, NA_real_), freedom = c(NA_real_,
    NA_real_, NA_real_, NA_real_, NA_real_, NA_real_), trust = c(NA_real_,
    NA_real_, NA_real_, NA_real_, NA_real_, NA_real_), generosity = c(NA_real_,
    NA_real_, NA_real_, NA_real_, NA_real_, NA_real_)), row.names = c(NA,
6L), class = "data.frame")
我在下面附上一张图片,展示了这个情节在处理前的样子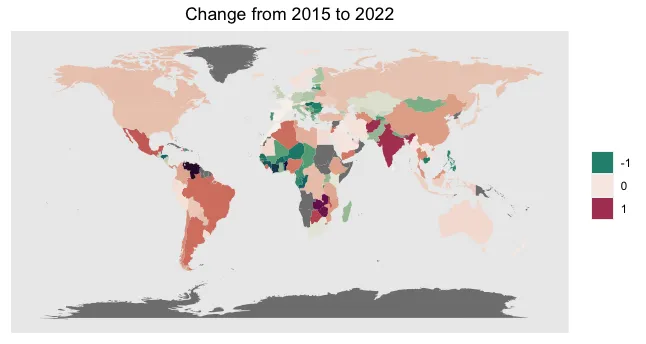
dput函数分享更多的数据,这样才能使问题可以复现。 - Quintenggplot或plotly图。 你没有从scale_fill_gradientn(colors = ocean.curl(150))得到错误吗? 你应该得到错误。 你只有三个颜色组。 根据图例中的指示,这些不是数字; 这是一个字符字段。 您应该收到有关向连续比例提供离散值的错误。 尝试注释掉那一行。 对于最快速的答案,如@Quinten所提到的关于dput,请使您的问题可以再现。 看看这个:making R reproducible questions。 - Kat