怎样使用这段代码:
import matplotlib.pyplot as plt
fig = plt.figure()
ax = fig.add_subplot(111)
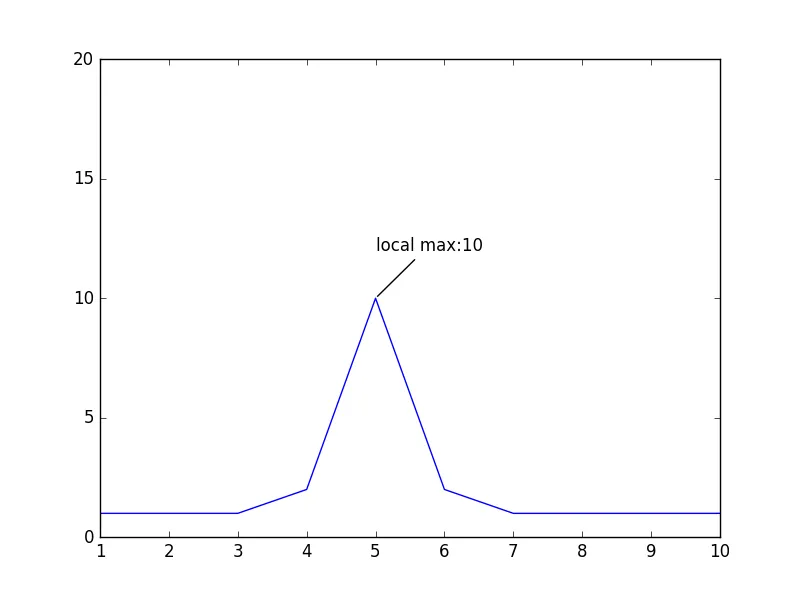
x=[1,2,3,4,5,6,7,8,9,10]
y=[1,1,1,2,10,2,1,1,1,1]
line, = ax.plot(x, y)
ymax = max(y)
xpos = y.index(ymax)
xmax = x[xpos]
arrow = ax.annotate('local max:' + str(ymax), xy=(xmax, ymax), xytext=(xmax, ymax + 2),
arrowprops=dict(arrowstyle = '-', connectionstyle = 'arc3',facecolor='red'))
#==============================================================================
# arrow.remove()
#==============================================================================
ax.set_ylim(0,20)
plt.show()
并且创建一个圆形标记(点),而不是箭头。尽管如此,我想保留箭头的文本。
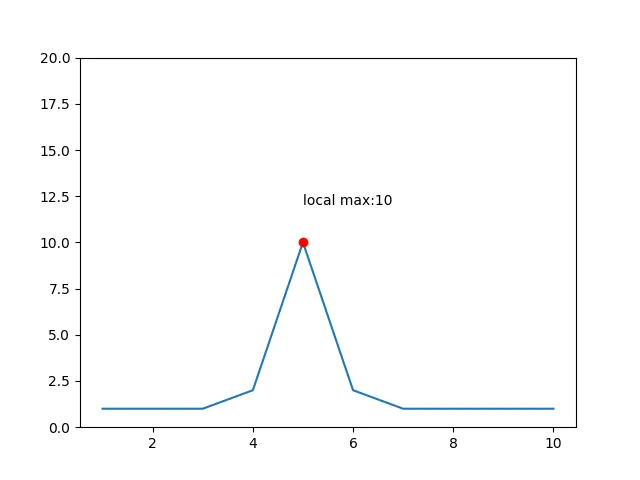
ms关键字,例如ax.plot(xmax, ymax, 'ro', ms=20)来定义标记大小。 - MPA