使用xtable或任何包,在R中创建一个表格,表头扩展到两列。

11

我想要将两个数据框的表格合并并将该表格导出到LaTeX文档中。我要创建的表格如下所示。请注意,下面的表格是使用Excel创建的。

enter image description here

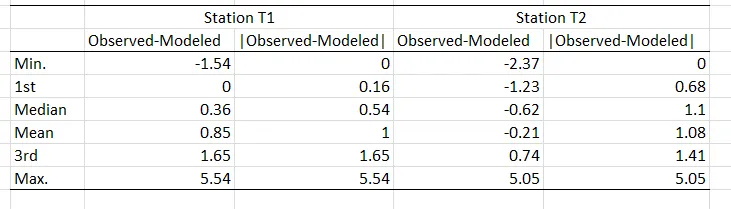
利用R中的xtable函数,我可以分别为两个站点导出表格。对于两个站点T1和T2,我得到了以下输出。如何将两个站点的输出组合起来以获得上述所需的输出?

T1站点:

> stT1
        Observed-modeled |observed-modeled|
Min.          -1.5360000          0.0001891
1st Qu.        0.0002512          0.1633000
Median         0.3593000          0.5390000
Mean           0.8554000          1.0020000
3rd Qu.        1.6470000          1.6470000
Max.           5.5370000          5.5370000

> dput(stT1)
structure(list(`Observed-modeled` = c(-1.536, 0.0002512, 0.3593, 
0.8554, 1.647, 5.537), `|observed-modeled|` = c(0.0001891, 0.1633, 
0.539, 1.002, 1.647, 5.537)), .Names = c("Observed-modeled", 
"|observed-modeled|"), row.names = c("Min.", "1st Qu.", "Median", 
"Mean", "3rd Qu.", "Max."), class = "data.frame")

车站 T2:

> stT2
        Observed-modeled |observed-modeled|
Min.             -2.3740           0.001259
1st Qu.          -1.2280           0.674700
Median           -0.6202           1.101000
Mean             -0.2094           1.085000
3rd Qu.           0.7418           1.413000
Max.              5.0530           5.053000

> dput(stT2)
structure(list(`Observed-modeled` = c(-2.374, -1.228, -0.6202, 
-0.2094, 0.7418, 5.053), `|observed-modeled|` = c(0.001259, 0.6747, 
1.101, 1.085, 1.413, 5.053)), .Names = c("Observed-modeled", 
"|observed-modeled|"), row.names = c("Min.", "1st Qu.", "Median", 
"Mean", "3rd Qu.", "Max."), class = "data.frame")

我将两个站点合并如下:

newstT <- cbind(stT1,stT2)

> newstT
        Observed-modeled |observed-modeled| Observed-modeled |observed-modeled|
Min.          -1.5360000          0.0001891          -2.3740           0.001259
1st Qu.        0.0002512          0.1633000          -1.2280           0.674700
Median         0.3593000          0.5390000          -0.6202           1.101000
Mean           0.8554000          1.0020000          -0.2094           1.085000
3rd Qu.        1.6470000          1.6470000           0.7418           1.413000
Max.           5.5370000          5.5370000           5.0530           5.053000

如期望的图示,我无法将T1站和T2站添加到顶部。


2
你可能想查看?xtable中的add.to.row - asb
1个回答

8
latex.tabular

如果您的数据是长格式的,这种方法会更有效。

library(tables)

# rbind with rownames as a column 
st <- rbind(
  data.frame(stT1, station = 'T1', what = factor(rownames(stT1), levels = rownames(stT1)), 
             row.names= NULL, check.names = FALSE), 
  data.frame(stT2,station = 'T2',what = factor(rownames(stT2), levels = rownames(stT2)), 
             row.names = NULL,check.names = FALSE)
     )


mytable <- tabular(Heading()*what ~ station*(`Observed-modeled` +`|observed-modeled|`)*Heading()*(identity),data=st)
mytable                                                                                
 ##         station                                                                
 ##         T1                                  T2                                 
 ##         Observed-modeled |observed-modeled| Observed-modeled |observed-modeled|
 ## Min.    -1.5360000       0.0001891          -2.3740          0.001259          
 ## 1st Qu.  0.0002512       0.1633000          -1.2280          0.674700          
 ## Median   0.3593000       0.5390000          -0.6202          1.101000          
 ## Mean     0.8554000       1.0020000          -0.2094          1.085000          
 ## 3rd Qu.  1.6470000       1.6470000           0.7418          1.413000          
 ## Max.     5.5370000       5.5370000           5.0530          5.053000

您可以对结果进行非常精细的控制,具体描述在vignette中。

在上面的例子中,您可以看到Heading()将抑制(或更改)列的标题,而identity是用于汇总每个组合的函数。

并且可以展示它会创建适当的表格latex对象(带有多列)。

latex(mytable)


\begin{tabular}{lcccc}
\hline
 & \multicolumn{4}{c}{station} \\ 
 & \multicolumn{2}{c}{T1} & \multicolumn{2}{c}{T2} \\ 
  & Observed-modeled & |observed-modeled| & Observed-modeled & \multicolumn{1}{c}{|observed-modeled|} \\ 
\hline
Min.  & $-1.5360000$ & $0.0001891$ & $-2.3740$ & $0.001259$ \\
1st Qu.  & $\phantom{-}0.0002512$ & $0.1633000$ & $-1.2280$ & $0.674700$ \\
Median  & $\phantom{-}0.3593000$ & $0.5390000$ & $-0.6202$ & $1.101000$ \\
Mean  & $\phantom{-}0.8554000$ & $1.0020000$ & $-0.2094$ & $1.085000$ \\
3rd Qu.  & $\phantom{-}1.6470000$ & $1.6470000$ & $\phantom{-}0.7418$ & $1.413000$ \\
Max.  & $\phantom{-}5.5370000$ & $5.5370000$ & $\phantom{-}5.0530$ & $5.053000$ \\
\hline 
\end{tabular}

如上所述,您可以使用Heading()*删除任何列标题,包括所涉及的列。

例如,要从第一行中删除“station”(作为所有列的标题):

tabular(Heading()*what ~ Heading()*station*(`Observed-modeled` +`|observed-modeled|`)*Heading()*(identity),data=st)
包有一种不同的构建表格的方法,它有一个方法来输出相关的LaTeX代码。

非常感谢您指出tables包。您的方法正是我所需要的。 - Jd Baba
能否将顶行的“station”去掉?其余部分都很完美。我想只保留“T1”和“T2”,而不是两行“station”、“T1”和“T2”。我可以手动在latex代码中删除该行,但我正在使用knitr,如果能够用代码删除会更方便。 - Jd Baba
@Jdbaba -- 使用 Heading()*station -- 请查看已编辑的答案。 - mnel
1
我注意到的一件事是,当tables包在上面的例子中使用latex(mytable)处理mytable时,它不会自动将|更改为$|$。因此,在通过latex或knitr处理时,会得到-observed-modeled -。除了手动编辑之外,是否有其他解决方法?xtable会自动在|周围放置美元符号,但tables不会。我有什么遗漏吗? - Jd Baba
问题不在于xtable,而在于“tables”包。我们可以使用“xtable”包执行上面所做的所有操作,这是您的意思吗? - Jd Baba
显示剩余2条评论

网页内容由stack overflow 提供, 点击上面的
可以查看英文原文,
原文链接