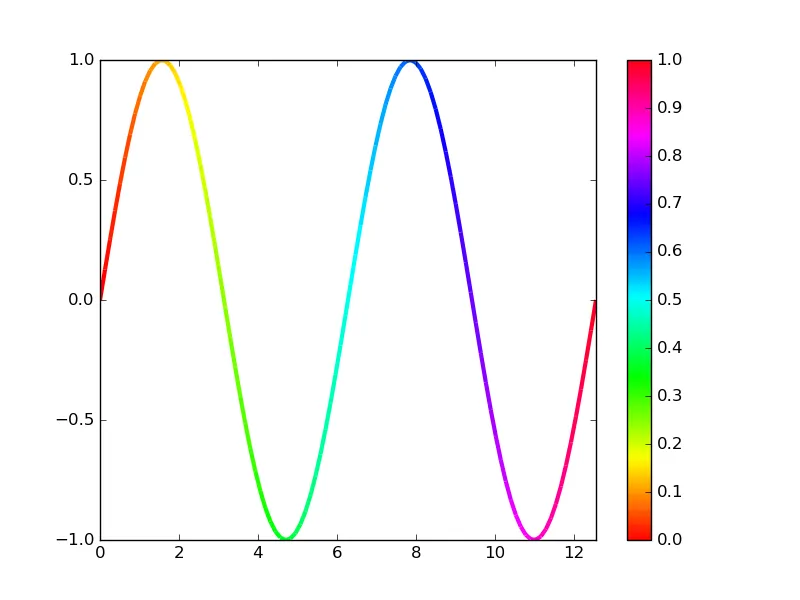
请查看Matplotlib图库中的多彩线条示例和dpsanders的colorline笔记本:
import numpy as np
import matplotlib.pyplot as plt
import matplotlib.collections as mcoll
def multicolored_lines():
"""
http://nbviewer.ipython.org/github/dpsanders/matplotlib-examples/blob/master/colorline.ipynb
http://matplotlib.org/examples/pylab_examples/multicolored_line.html
"""
x = np.linspace(0, 4. * np.pi, 100)
y = np.sin(x)
fig, ax = plt.subplots()
lc = colorline(x, y, cmap='hsv')
plt.colorbar(lc)
plt.xlim(x.min(), x.max())
plt.ylim(-1.0, 1.0)
plt.show()
def colorline(
x, y, z=None, cmap='copper', norm=plt.Normalize(0.0, 1.0),
linewidth=3, alpha=1.0):
"""
http://nbviewer.ipython.org/github/dpsanders/matplotlib-examples/blob/master/colorline.ipynb
http://matplotlib.org/examples/pylab_examples/multicolored_line.html
Plot a colored line with coordinates x and y
Optionally specify colors in the array z
Optionally specify a colormap, a norm function and a line width
"""
if z is None:
z = np.linspace(0.0, 1.0, len(x))
if not hasattr(z, "__iter__"):
z = np.array([z])
z = np.asarray(z)
segments = make_segments(x, y)
lc = mcoll.LineCollection(segments, array=z, cmap=cmap, norm=norm,
linewidth=linewidth, alpha=alpha)
ax = plt.gca()
ax.add_collection(lc)
return lc
def make_segments(x, y):
"""
Create list of line segments from x and y coordinates, in the correct format
for LineCollection: an array of the form numlines x (points per line) x 2 (x
and y) array
"""
points = np.array([x, y]).T.reshape(-1, 1, 2)
segments = np.concatenate([points[:-1], points[1:]], axis=1)
return segments
multicolored_lines()
请注意,调用plt.plot数百次会影响性能。
使用 LineCollection 构建多色线段要快得多。