我正在尝试为密度图制作一个框架。我从以下内容开始:
set terminal pngcairo size 400,400 enhanced
set output 'test.png'
set view map
unset tics
unset colorbox
set size ratio 1
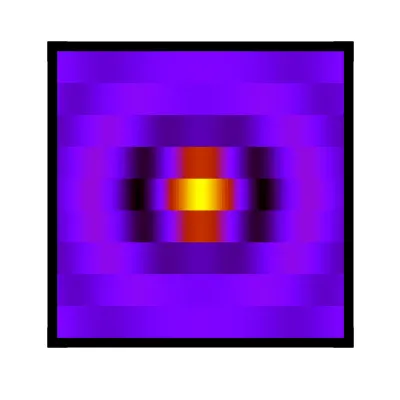
set border 15 front lw 20
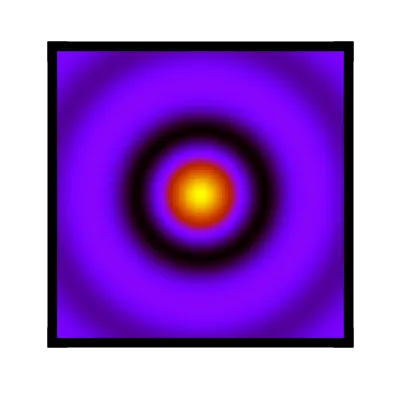
#set border 15 back lw 20
splot sin(sqrt(x**2+y**2))/sqrt(x**2+y**2) w pm3d notitle
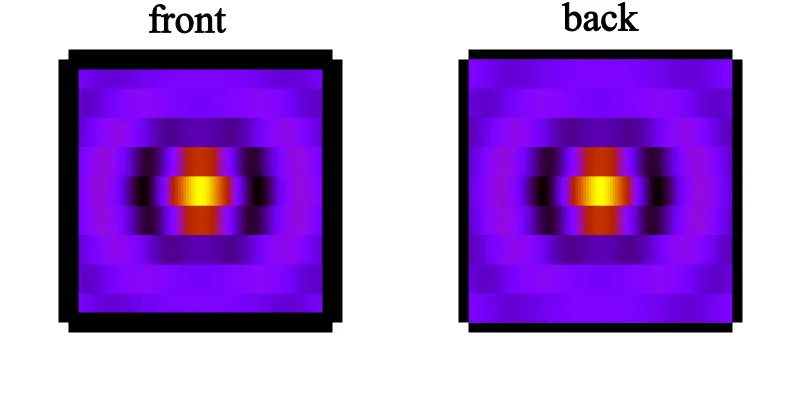
front,边框看起来是连续的,但会占用一部分绘图区域。如果我使用back,它不再像一个框架。如何制作一个合适的框架,使其保持在绘图区域之外?