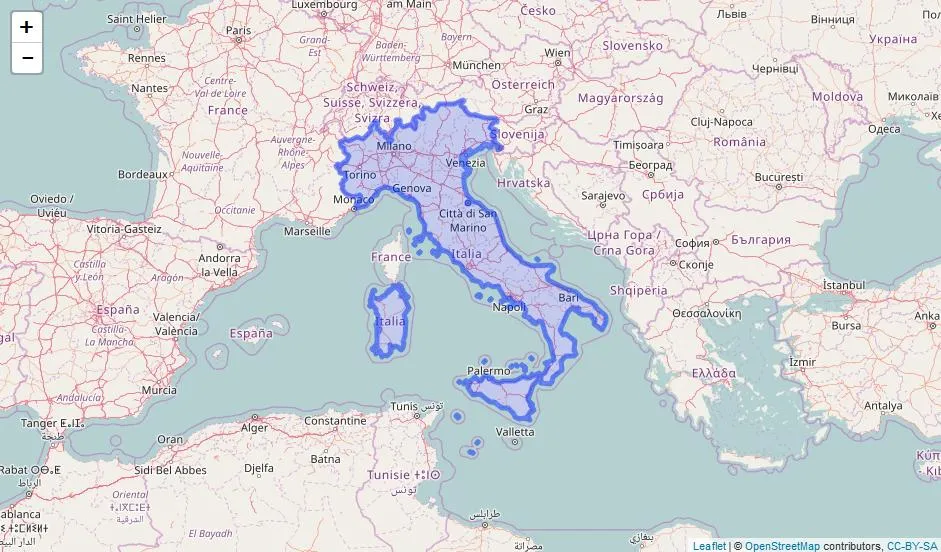
你可以直接使用从maps获取的多边形。当然,任何其他合适的来源都可以使用,就像@JanLauGe提到的那样。
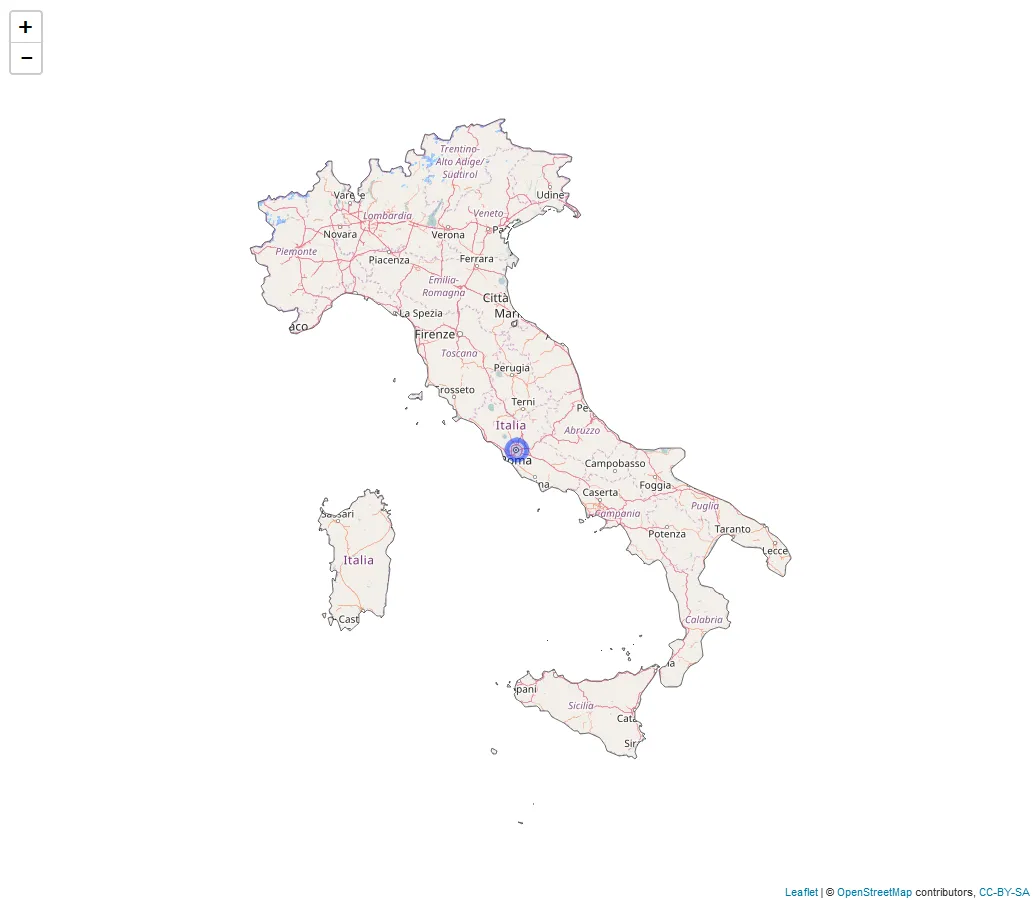
在获取了特定国家的多边形后,您可以将其转换为SpatialPolygonsDataFrame并将其提供给Leafet。如果您只想显示感兴趣的区域,则还可以创建掩码。
自然地,在此之后,您可以使用标准的Leaflet方法(如addCircleMarkers( lng, lat ))轻松添加任何点或标记。
library(ggmap)
library(leaflet)
library(magrittr)
library(maps)
library(maptools)
library(raster)
library(rgeos)
library(sp)
country <- 'italy';
zoomLevel <- 6;
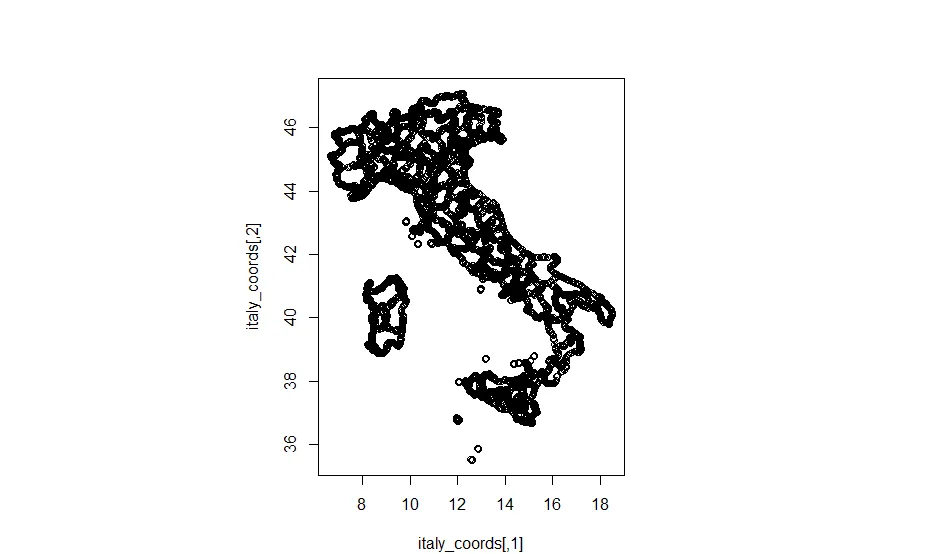
ita.map <- map( country, fill = TRUE, col = 1, plot = F );
ita.center <- geocode( "italy" );
ita.map.ids <- sapply( strsplit( ita.map$names, ':' ), function(x) x[1] );
ita.sp <- map2SpatialPolygons( ita.map, IDs=ita.map.ids,
proj4string=CRS("+proj=longlat +datum=WGS84"))
tmp.id.df <- data.frame( ID = names(ita.sp) );
rownames( tmp.id.df ) <- names( ita.sp );
ita.spdf <- SpatialPolygonsDataFrame( ita.sp, tmp.id.df );
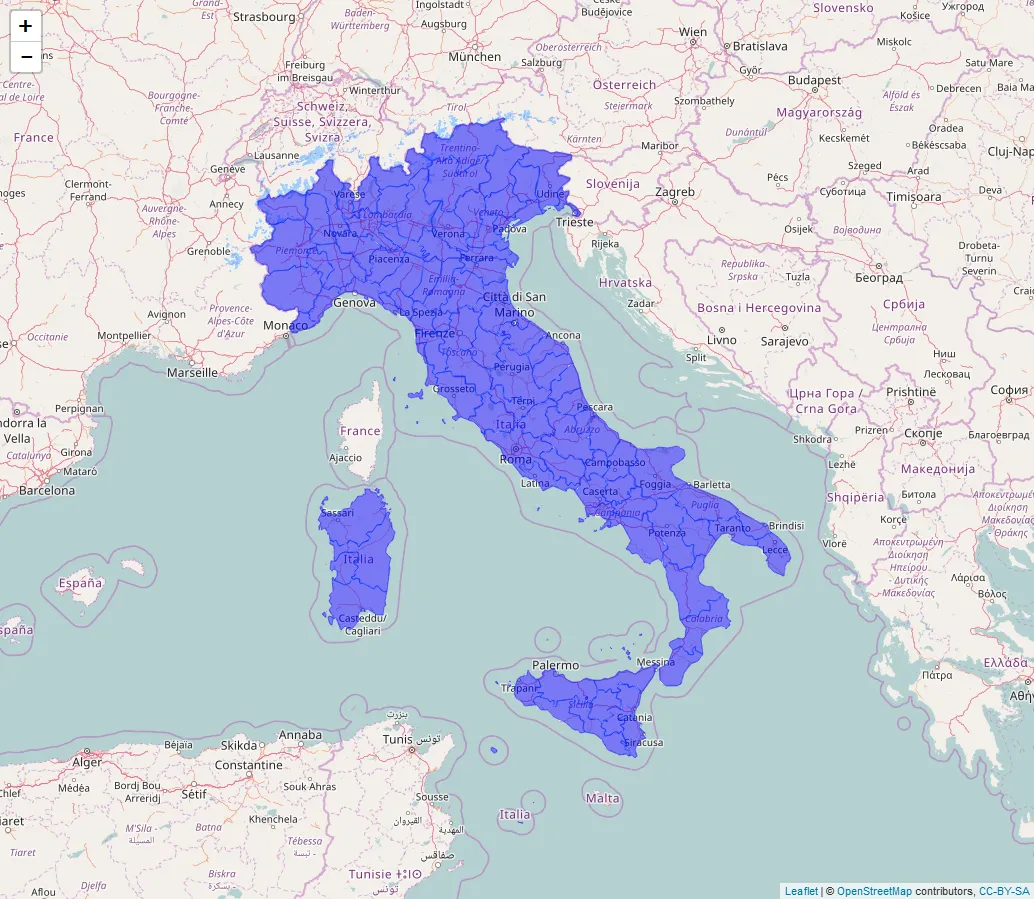
l.ita.map <- leaflet( ita.spdf ) %>%
setView(lng = ita.center$lon, lat = ita.center$lat, zoom = zoomLevel ) %>%
addTiles() %>%
addPolygons( data = ita.spdf, weight = 1, fillColor = "blue", fillOpacity = 0.5 );
l.ita.map
####### Alternatively if a mask if needed #######

# Get a plane of the world
wld.sp <- rasterToPolygons( raster(ncol = 1, nrow = 1, crs = proj4string(ita.sp) ) );
# Cut our country polygon from the plane to get our target mask
ita.sp.mask <- gDifference( wld.sp, ita.sp );

# Convert our ita.sp.mask (SpatialPolygons) to SpatialPolygonsDataFrame
tmp.id.df <- data.frame( ID = "1" );
rownames( tmp.id.df ) <- names( ita.sp.mask );
ita.mask.spdf <- SpatialPolygonsDataFrame( ita.sp.mask, tmp.id.df );

# Coordinates of Rome
ita.rome.center <- geocode( "Rome, italy" );

# Visualize
l.ita.mask.map <- leaflet( ita.mask.spdf ) %>%
    setView( lng = ita.center$lon, lat = ita.center$lat, zoom = zoomLevel ) %>%
    addTiles() %>%
    addPolygons( data = ita.mask.spdf, fillColor = "white", fillOpacity = 1.0, color = "black", weight = 1 ) %>%
addCircleMarkers(lng = ita.rome.center$lon, lat = ita.rome.center$lat );

l.ita.mask.map;
感谢@fdetsch提供的建议!