如果我已经有一个y轴比例尺,如何在ggplot2图表中使用逗号(和K?MM?)格式化坐标轴标签

39
我试图格式化成千的成本和收入以及百万的印象数据,用于ggplot图形的y轴标签。 我的图表从31天前到“昨天”运行,并在该期间使用最小值和最大值作为ylim(c(min,max))选项。以成本为例说明。
library(ggplot2)
library(TTR)

set.seed(1984)

#make series
start <- as.Date('2016-01-01')
end <- Sys.Date()

days <- as.numeric(end - start)

#make cost and moving averages
cost <- rnorm(days, mean = 45400, sd = 11640)
date <- seq.Date(from = start, to = end - 1, by = 'day') 
cost_7 <- SMA(cost, 7)
cost_30 <- SMA(cost, 30)

df <- data.frame(Date = date, Cost = cost, Cost_7 = cost_7, Cost_30 = cost_30)


# set parameters for window
left <- end - 31
right <- end - 1

# plot series
ggplot(df, aes(x = Date, y = Cost))+
geom_line(lwd = 0.5) +
geom_line(aes(y = Cost_7), col = 'red', linetype = 3, lwd = 1) +
geom_line(aes(y = Cost_30), col = 'blue', linetype = 5, lwd = 0.75) +
xlim(c(left, right)) + 
ylim(c(min(df$Cost[df$Date > left]), max(df$Cost[df$Date > left]))) +
xlab("")

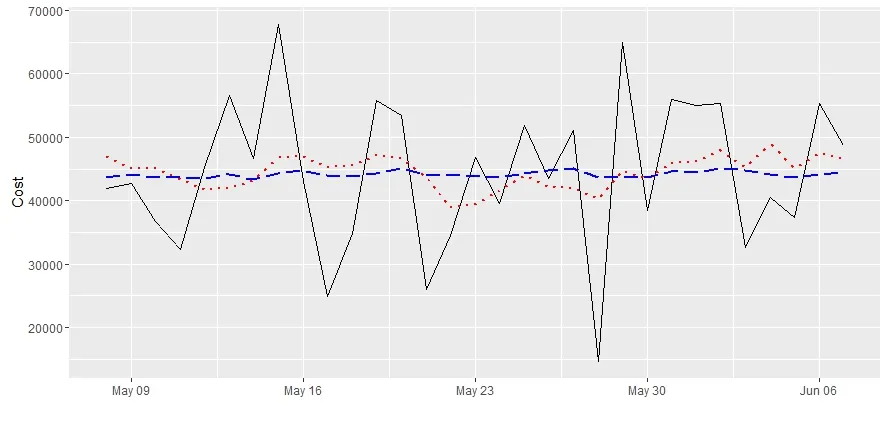
ggplot 输出

我希望 a) 在 y 轴上用逗号表示千位和百万位数,并希望这些数字缩写为 'K' 表示千或 'MM' 表示百万。 我意识到 b) 可能很难实现,但目前 a) 无法通过以下方式实现:

ggplot(...) + ... + ylim(c(min, max)) + scale_y_continuous(labels = comma)

因为会抛出以下错误:

## Scale for 'y' is already present. Adding another scale for 'y', which
## will replace the existing scale.
我尝试将scale_y_continuous(labels = comma)部分放置在geom_line()图层后面(这会引发上述错误),或者放置在所有ggplot图层的末尾,但这会覆盖我在ylim调用中设置的限制,然后仍会引发上述错误。你们有任何想法吗?
3个回答

70

对于逗号格式化,您需要在中引入scales库。您所讨论的“错误”实际上只是一种警告,因为您同时使用了ylimscale_y_continuous。第二个调用覆盖了第一个。您可以改为在单个调用中设置限制并指定逗号分隔的标签:scale_y_continuous

library(scales)

ggplot(df, aes(x = Date, y = Cost))+
  geom_line(lwd = 0.5) +
  geom_line(aes(y = Cost_7), col = 'red', linetype = 3, lwd = 1) +
  geom_line(aes(y = Cost_30), col = 'blue', linetype = 5, lwd = 0.75) +
  xlim(c(left, right)) + 
  xlab("") +
  scale_y_continuous(label=comma, limits=c(min(df$Cost[df$Date > left]), 
                                           max(df$Cost[df$Date > left])))

另一个选项是在绘图之前将数据融合为长格式,这将减少所需的代码量并简化美学映射:

library(reshape2)

ggplot(melt(df, id.var="Date"), 
       aes(x = Date, y = value, color=variable, linetype=variable))+
  geom_line() +
  xlim(c(left, right)) + 
  labs(x="", y="Cost") +
  scale_y_continuous(label=comma, limits=c(min(df$Cost[df$Date > left]), 
                                           max(df$Cost[df$Date > left])))

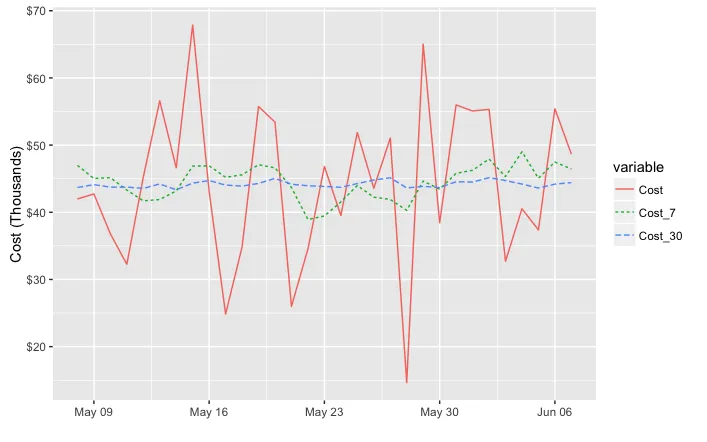
无论如何,若要将y值表示为千或百万的形式,您可以将y值除以1,000或1,000,000。我在下面使用了dollar_format(),但是如果您使用unit_format(根据@joran的建议),您还需要除以适当的十次幂。例如:

div=1000

ggplot(melt(df, id.var="Date"), 
       aes(x = Date, y = value/div, color=variable, linetype=variable))+
  geom_line() +
  xlim(c(left, right)) + 
  labs(x="", y="Cost (Thousands)") +
  scale_y_continuous(label=dollar_format(),
                     limits=c(min(df$Cost[df$Date > left]), 
                              max(df$Cost[df$Date > left]))/div)

如有需要,使用scale_color_manualscale_linetype_manual设置自定义颜色和线条类型。

enter image description here


4
尝试查看 scales 包中的 unit_format 以了解(b)部分的内容。 - joran
9
很确定。label = unit_format(unit = "K")的意思是“标签=label,单位为千”。 - joran
7
“嗯,这也太简单了吧。”在 R 里,一旦你掌握了诀窍,一切都变得简单! - eipi10
4
@joran的unit_format看起来非常有用;然而我注意到scale_y_continuous(label = unit_format(unit = "m", scale = 1e-6))将把6000000缩写为 6 m。虽不是什么大事,但在英国使用 **6m**(无空格)更为普遍。 - Konrad
8
你可以在 unit_format 中使用 sep 字段来去除空格。例如,unit_format(unit = "M", scale = 1e-6, sep = "")。参见 (https://www.rdocumentation.org/packages/scales/versions/0.4.1/topics/unit_format)。 - user3062149
显示剩余7条评论

19

我刚刚找到了解决方案。它不适用于"label = comma"。请尝试这个解决方案:

scale_y_continuous(labels = scales::comma)

这对我很有效。


3
unit_format() 函数已被 scales 包弃用,取而代之的是 label_number()。它默认使用空格作为分隔符,可通过 big.mark= 参数更改。使用 prefix = suffix = 参数在数字前后添加字符,并使用 scale = 参数将数字乘以缩放因子(因此在许多情况下您需要在此处使用负指数)。
@konrad 提到的数字和后缀之间的空格问题似乎不再存在。如果需要一个空格,请在后缀参数中包含它,例如:suffix = " M"
例如,要在 y 轴上显示 1234000 为 £1,234k,则应使用以下代码: scale_y_continuous(labels = label_number(prefix = "£", suffix = "k", scale = 1e-3, big.mark = ",")) 由于逗号分隔符非常常用,因此提供了一个方便函数 label_comma,它将 big.mark = "," 设置为逗号。或者,为了更少的输入,可以使用完全相同的 comma() 函数。
注意: scales 包没有作为 library(ggplot) 的依赖项加载,您必须单独加载它,或者按照 @Aurora 在他们的答案中指出的方式,使用前缀 scales::
参考链接:https://scales.r-lib.org/reference/label_number.html

网页内容由stack overflow 提供, 点击上面的
可以查看英文原文,
原文链接