我该如何从一个数字矩阵生成等轴测图?我需要一些思路。
例子:
矩阵:
[[3,2],
[1,1]]
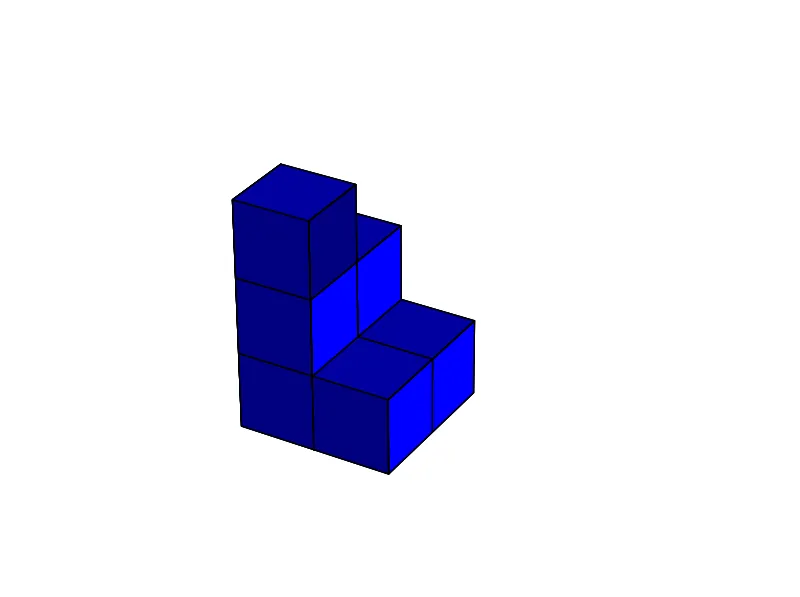
这个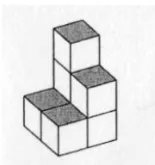 每个数字代表高度,3代表第一列有三个方块高度,2代表第一列第二个元素有两个方块高度。
谢谢。
例子:
矩阵:
[[3,2],
[1,1]]
这个
每个数字代表高度,3代表第一列有三个方块高度,2代表第一列第二个元素有两个方块高度。谢谢。
每个数字代表高度,3代表第一列有三个方块高度,2代表第一列第二个元素有两个方块高度。import matplotlib as mpl
from mpl_toolkits.mplot3d import Axes3D
import numpy as np
import matplotlib.pyplot as plt
def cuboid_data(center, size=(1,1,1)):
# code taken from
# https://dev59.com/U4vda4cB1Zd3GeqPdb-g?noredirect=1&lq=1
# suppose axis direction: x: to left; y: to inside; z: to upper
# get the (left, outside, bottom) point
o = [a - b / 2 for a, b in zip(center, size)]
# get the length, width, and height
l, w, h = size
x = [[o[0], o[0] + l, o[0] + l, o[0], o[0]], # x coordinate of points in bottom surface
[o[0], o[0] + l, o[0] + l, o[0], o[0]], # x coordinate of points in upper surface
[o[0], o[0] + l, o[0] + l, o[0], o[0]], # x coordinate of points in outside surface
[o[0], o[0] + l, o[0] + l, o[0], o[0]]] # x coordinate of points in inside surface
y = [[o[1], o[1], o[1] + w, o[1] + w, o[1]], # y coordinate of points in bottom surface
[o[1], o[1], o[1] + w, o[1] + w, o[1]], # y coordinate of points in upper surface
[o[1], o[1], o[1], o[1], o[1]], # y coordinate of points in outside surface
[o[1] + w, o[1] + w, o[1] + w, o[1] + w, o[1] + w]] # y coordinate of points in inside surface
z = [[o[2], o[2], o[2], o[2], o[2]], # z coordinate of points in bottom surface
[o[2] + h, o[2] + h, o[2] + h, o[2] + h, o[2] + h], # z coordinate of points in upper surface
[o[2], o[2], o[2] + h, o[2] + h, o[2]], # z coordinate of points in outside surface
[o[2], o[2], o[2] + h, o[2] + h, o[2]]] # z coordinate of points in inside surface
return x, y, z
def plotCubeAt(pos=(0,0), N=0, ax=None):
# Plotting N cube elements at position pos
if ax !=None:
if N > 0:
for n in range(N):
X, Y, Z = cuboid_data( (pos[0],pos[1],n) )
ax.plot_surface(X, Y, Z, color='b', rstride=1, cstride=1, alpha=1)
def plotIsoMatrix(ax, matrix):
# plot a Matrix
# where matrix[i,j] cubes are added at position (i,j)
for i in range(matrix.shape[0]):
for j in range(matrix.shape[1]):
plotCubeAt(pos=(i,j), N=matrix[i,j], ax=ax)
l = max(matrix.shape[0], matrix.shape[1], matrix.max())
bb = np.array([(0,0,0), (0,l,0), (l,0,0), (l,l,0),(0,0,l), (0,l,l), (l,0,l), (l,l,l)])
ax.plot(bb[:,0], bb[:,1], bb[:,2], "w", alpha=0.0)
if __name__ == '__main__':
fig = plt.figure()
ax = fig.gca(projection='3d')
ax.set_aspect('equal')
matrix = np.array([[3,2],[1,1]])
plotIsoMatrix(ax, matrix)
ax.set_axis_off()
plt.show()