将变量拆分为多个因子变量。

4

我有一个类似于以下数据集:

df <- data.frame(n = seq(1:1000000), x = sample(LETTERS, 1000000, replace = T))

我想知道如何将变量x分割成多个范围为0-1的分类变量。

最终结果应该是这样的:

n x A B C D E F G H . . .
1 D 0 0 0 1 0 0 0 0 . . .
2 B 0 1 0 0 0 0 0 0 . . .
3 F 0 0 0 0 0 1 0 0 . . .

在我的数据集中,变量x中的代码数量要比其他变量多得多,因此手动添加每个新变量将耗费太多时间。
我考虑对变量x中的代码进行排序,并为每个代码分配一个唯一的编号,然后创建一个迭代循环,为变量x中的每个代码创建一个新变量。 但我感觉自己过于复杂了。

5个回答

3

使用match。首先创建一个全为零的向量,然后使用字母表中的向量将df行的字母匹配并转换为1。您可以使用内置的LETTERS常数。最后,将其向量化并使用cbind

f <- \(x) {
  z <- numeric(length(LETTERS))
  z[match(x, LETTERS)] <- 1
  setNames(z, LETTERS)
}

cbind(df, t(Vectorize(f)(df$x)))
#      n x A B C D E F G H I J K L M N O P Q R S T U V W X Y Z
# Q    1 Q 0 0 0 0 0 0 0 0 0 0 0 0 0 0 0 0 1 0 0 0 0 0 0 0 0 0
# E    2 E 0 0 0 0 1 0 0 0 0 0 0 0 0 0 0 0 0 0 0 0 0 0 0 0 0 0
# A    3 A 1 0 0 0 0 0 0 0 0 0 0 0 0 0 0 0 0 0 0 0 0 0 0 0 0 0
# Y    4 Y 0 0 0 0 0 0 0 0 0 0 0 0 0 0 0 0 0 0 0 0 0 0 0 0 1 0
# J    5 J 0 0 0 0 0 0 0 0 0 1 0 0 0 0 0 0 0 0 0 0 0 0 0 0 0 0
# D    6 D 0 0 0 1 0 0 0 0 0 0 0 0 0 0 0 0 0 0 0 0 0 0 0 0 0 0
# R    7 R 0 0 0 0 0 0 0 0 0 0 0 0 0 0 0 0 0 1 0 0 0 0 0 0 0 0
# Z    8 Z 0 0 0 0 0 0 0 0 0 0 0 0 0 0 0 0 0 0 0 0 0 0 0 0 0 1
# Q.1  9 Q 0 0 0 0 0 0 0 0 0 0 0 0 0 0 0 0 1 0 0 0 0 0 0 0 0 0
# O   10 O 0 0 0 0 0 0 0 0 0 0 0 0 0 0 1 0 0 0 0 0 0 0 0 0 0 0

或者,将x转换为一个因子类型,使用LETTERS作为水平级别,并使用model.matrix

df <- transform(df, x=factor(x, levels=LETTERS))

cbind(df, `colnames<-`(model.matrix(~ 0 + x, df), LETTERS))
#     n x A B C D E F G H I J K L M N O P Q R S T U V W X Y Z
# 1   1 Q 0 0 0 0 0 0 0 0 0 0 0 0 0 0 0 0 1 0 0 0 0 0 0 0 0 0
# 2   2 E 0 0 0 0 1 0 0 0 0 0 0 0 0 0 0 0 0 0 0 0 0 0 0 0 0 0
# 3   3 A 1 0 0 0 0 0 0 0 0 0 0 0 0 0 0 0 0 0 0 0 0 0 0 0 0 0
# 4   4 Y 0 0 0 0 0 0 0 0 0 0 0 0 0 0 0 0 0 0 0 0 0 0 0 0 1 0
# 5   5 J 0 0 0 0 0 0 0 0 0 1 0 0 0 0 0 0 0 0 0 0 0 0 0 0 0 0
# 6   6 D 0 0 0 1 0 0 0 0 0 0 0 0 0 0 0 0 0 0 0 0 0 0 0 0 0 0
# 7   7 R 0 0 0 0 0 0 0 0 0 0 0 0 0 0 0 0 0 1 0 0 0 0 0 0 0 0
# 8   8 Z 0 0 0 0 0 0 0 0 0 0 0 0 0 0 0 0 0 0 0 0 0 0 0 0 0 1
# 9   9 Q 0 0 0 0 0 0 0 0 0 0 0 0 0 0 0 0 1 0 0 0 0 0 0 0 0 0
# 10 10 O 0 0 0 0 0 0 0 0 0 0 0 0 0 0 1 0 0 0 0 0 0 0 0 0 0 0

数据:

n <- 10
set.seed(42)
df <- data.frame(n = seq(1:n), x = sample(LETTERS, n, replace = T))

3

一种快速而简单的方法是使用 fastDummies::dummy_cols

fastDummies::dummy_cols(df, "x")

使用tidyverse函数的另一种选择:

library(tidyverse)

df %>% 
  left_join(., df %>% mutate(value = 1) %>% 
              pivot_wider(names_from = x, values_from = value, values_fill = 0) %>% 
              relocate(n, sort(colnames(.)[-1])))

输出

> dummmy <- fastDummies::dummy_cols(df, "x")
> colnames(dummy)[-c(1,2)] <- LETTERS
> dummy

    n x A B C D E F G H I J K L M N O P Q R S T U V W X Y Z
1   1 Z 0 0 0 0 0 0 0 0 0 0 0 0 0 0 0 0 0 0 0 0 0 0 0 0 0 1
2   2 Q 0 0 0 0 0 0 0 0 0 0 0 0 0 0 0 0 1 0 0 0 0 0 0 0 0 0
3   3 E 0 0 0 0 1 0 0 0 0 0 0 0 0 0 0 0 0 0 0 0 0 0 0 0 0 0
4   4 H 0 0 0 0 0 0 0 1 0 0 0 0 0 0 0 0 0 0 0 0 0 0 0 0 0 0
5   5 T 0 0 0 0 0 0 0 0 0 0 0 0 0 0 0 0 0 0 0 1 0 0 0 0 0 0
6   6 X 0 0 0 0 0 0 0 0 0 0 0 0 0 0 0 0 0 0 0 0 0 0 0 1 0 0
7   7 R 0 0 0 0 0 0 0 0 0 0 0 0 0 0 0 0 0 1 0 0 0 0 0 0 0 0
8   8 F 0 0 0 0 0 1 0 0 0 0 0 0 0 0 0 0 0 0 0 0 0 0 0 0 0 0
9   9 Z 0 0 0 0 0 0 0 0 0 0 0 0 0 0 0 0 0 0 0 0 0 0 0 0 0 1
10 10 S 0 0 0 0 0 0 0 0 0 0 0 0 0 0 0 0 0 0 1 0 0 0 0 0 0 0

基准测试 由于有很多解决方案且问题涉及大型数据集,进行基准测试可能会有所帮助。根据基准测试,nnet解决方案是最快的。

set.seed(1)
df <- data.frame(n = seq(1:1000000), x = sample(LETTERS, 1000000, replace = T))

library(microbenchmark)
bm <- microbenchmark(
  fModel.matrix(),
  fContrasts(),
  fnnet(),
  fdata.table(),
  fFastDummies(),
  fDplyr(),
  times = 10L,
  setup = gc(FALSE)
)
autoplot(bm)

enter image description here


1
你是否也有定义fModel.matrixfContrasts等的代码?只是想看看它们的实现,以便能够添加其他方法或自己运行它。 - GKi

1

这里的主要问题是资源吗?我认为。我发现使用 nnet 是一个快速的解决方案:

library(nnet)
library(dplyr)

df %>% cbind(class.ind(.$x) == 1) %>% 
  mutate(across(-c(n, x), ~.*1))

   n x A B C D E F G H I J K L M N O P Q R S T U V W X Y Z
1   1 E 0 0 0 0 1 0 0 0 0 0 0 0 0 0 0 0 0 0 0 0 0 0 0 0 0 0
2   2 H 0 0 0 0 0 0 0 1 0 0 0 0 0 0 0 0 0 0 0 0 0 0 0 0 0 0
3   3 L 0 0 0 0 0 0 0 0 0 0 0 1 0 0 0 0 0 0 0 0 0 0 0 0 0 0
4   4 M 0 0 0 0 0 0 0 0 0 0 0 0 1 0 0 0 0 0 0 0 0 0 0 0 0 0
5   5 R 0 0 0 0 0 0 0 0 0 0 0 0 0 0 0 0 0 1 0 0 0 0 0 0 0 0
6   6 A 1 0 0 0 0 0 0 0 0 0 0 0 0 0 0 0 0 0 0 0 0 0 0 0 0 0
7   7 Y 0 0 0 0 0 0 0 0 0 0 0 0 0 0 0 0 0 0 0 0 0 0 0 0 1 0
8   8 Y 0 0 0 0 0 0 0 0 0 0 0 0 0 0 0 0 0 0 0 0 0 0 0 0 1 0
9   9 F 0 0 0 0 0 1 0 0 0 0 0 0 0 0 0 0 0 0 0 0 0 0 0 0 0 0
10 10 U 0 0 0 0 0 0 0 0 0 0 0 0 0 0 0 0 0 0 0 0 1 0 0 0 0 0
11 11 O 0 0 0 0 0 0 0 0 0 0 0 0 0 0 1 0 0 0 0 0 0 0 0 0 0 0
12 12 I 0 0 0 0 0 0 0 0 1 0 0 0 0 0 0 0 0 0 0 0 0 0 0 0 0 0
13 13 O 0 0 0 0 0 0 0 0 0 0 0 0 0 0 1 0 0 0 0 0 0 0 0 0 0 0
14 14 Z 0 0 0 0 0 0 0 0 0 0 0 0 0 0 0 0 0 0 0 0 0 0 0 0 0 1
15 15 P 0 0 0 0 0 0 0 0 0 0 0 0 0 0 0 1 0 0 0 0 0 0 0 0 0 0
16 16 T 0 0 0 0 0 0 0 0 0 0 0 0 0 0 0 0 0 0 0 1 0 0 0 0 0 0
17 17 F 0 0 0 0 0 1 0 0 0 0 0 0 0 0 0 0 0 0 0 0 0 0 0 0 0 0
18 18 K 0 0 0 0 0 0 0 0 0 0 1 0 0 0 0 0 0 0 0 0 0 0 0 0 0 0
19 19 H 0 0 0 0 0 0 0 1 0 0 0 0 0 0 0 0 0 0 0 0 0 0 0 0 0 0
20 20 V 0 0 0 0 0 0 0 0 0 0 0 0 0 0 0 0 0 0 0 0 0 1 0 0 0 0
21 21 V 0 0 0 0 0 0 0 0 0 0 0 0 0 0 0 0 0 0 0 0 0 1 0 0 0 0
22 22 G 0 0 0 0 0 0 1 0 0 0 0 0 0 0 0 0 0 0 0 0 0 0 0 0 0 0
23 23 P 0 0 0 0 0 0 0 0 0 0 0 0 0 0 0 1 0 0 0 0 0 0 0 0 0 0
24 24 Q 0 0 0 0 0 0 0 0 0 0 0 0 0 0 0 0 1 0 0 0 0 0 0 0 0 0
25 25 V 0 0 0 0 0 0 0 0 0 0 0 0 0 0 0 0 0 0 0 0 0 1 0 0 0 0
26 26 R 0 0 0 0 0 0 0 0 0 0 0 0 0 0 0 0 0 1 0 0 0 0 0 0 0 0
27 27 Q 0 0 0 0 0 0 0 0 0 0 0 0 0 0 0 0 1 0 0 0 0 0 0 0 0 0
28 28 B 0 1 0 0 0 0 0 0 0 0 0 0 0 0 0 0 0 0 0 0 0 0 0 0 0 0
29 29 D 0 0 0 1 0 0 0 0 0 0 0 0 0 0 0 0 0 0 0 0 0 0 0 0 0 0
30 30 M 0 0 0 0 0 0 0 0 0 0 0 0 1 0 0 0 0 0 0 0 0 0 0 0 0 0
31 31 E 0 0 0 0 1 0 0 0 0 0 0 0 0 0 0 0 0 0 0 0 0 0 0 0 0 0
32 32 V 0 0 0 0 0 0 0 0 0 0 0 0 0 0 0 0 0 0 0 0 0 1 0 0 0 0
33 33 S 0 0 0 0 0 0 0 0 0 0 0 0 0 0 0 0 0 0 1 0 0 0 0 0 0 0
34 34 Y 0 0 0 0 0 0 0 0 0 0 0 0 0 0 0 0 0 0 0 0 0 0 0 0 1 0
35 35 T 0 0 0 0 0 0 0 0 0 0 0 0 0 0 0 0 0 0 0 1 0 0 0 0 0 0
 [ reached 'max' / getOption("max.print") -- omitted 999965 rows ]
> 

1
另一个选择是使用==
. <- unique(df$x)
cbind(df, +do.call(cbind, lapply(setNames(., .), `==`, df$x)))
#  n x C I L T Y
#1 1 I 0 1 0 0 0
#2 2 C 1 0 0 0 0
#3 3 C 1 0 0 0 0
#4 4 Y 0 0 0 0 1
#5 5 L 0 0 1 0 0
#6 6 T 0 0 0 1 0
#...

或者使用sapply在一行中完成。

cbind(df, +sapply(unique(df$x), `==`, df$x))

或者使用contrasts并将其与df$x匹配。

. <- contrasts(as.factor(df$x), FALSE)
#. <- contrasts(as.factor(unique(df$x)), FALSE) #Alternative
cbind(df, .[match(df$x, rownames(.)),])
#cbind(df, .[fastmatch::fmatch(df$x, rownames(.)),]) #Alternative

在矩阵中进行索引,即使用matrix
. <- unique(df$x) #Could be sorted
#. <- collapse::funique(df$x) #Alternative
#. <- kit::funique(df$x) #Alternative
i <- match(df$x, .)
#i <- fastmatch::fmatch(df$x, .) #Alternative
#i <- data.table::chmatch(df$x, .) #Alternative
nc <- length(.)
nr <- length(i)
cbind(df, matrix(`[<-`(integer(nc * nr), 1:nr + nr * (i - 1), 1), nr, nc,
                 dimnames=list(NULL, .)))

或者使用outer
. <- unique(df$x)
cbind(df, +outer(df$x, setNames(., .), `==`))

或者使用rep和`matrix`。
. <- unique(df$x)
n <- nrow(df)
cbind(df, +matrix(df$x == rep(., each=n), n, dimnames=list(NULL, .)))

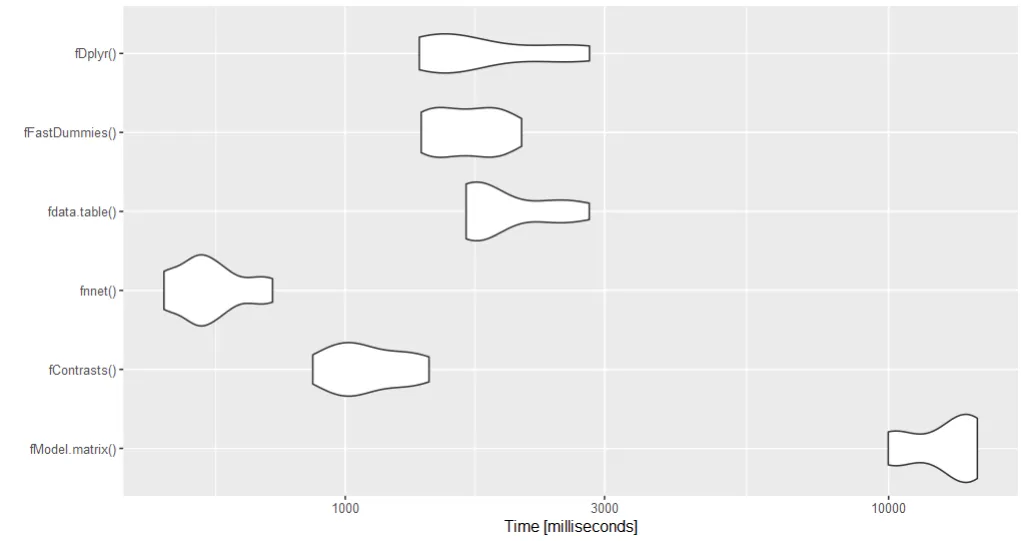
对于更多变量 x 中的代码,而不仅仅是 e.g. LETTERS,一些可用的方法进行基准测试。

set.seed(42)
df <- data.frame(n = seq(1:1000000), x = sample(LETTERS, 1000000, replace = T))

library(nnet)
library(dplyr)

microbenchmark::microbenchmark(times = 10L, setup = gc(FALSE), control=list(order="block")
, "nnet" = df %>% cbind(class.ind(.$x) == 1) %>% 
  mutate(across(-c(n, x), ~.*1))

, "contrasts" = {. <- contrasts(as.factor(df$x), FALSE)
  cbind(df, .[match(df$x, rownames(.)),])}
  
, "==" = {. <- unique(df$x)
  cbind(df, +do.call(cbind, lapply(setNames(., .), `==`, df$x)))}

, "==Sapply" = cbind(df, +sapply(unique(df$x), `==`, df$x))

, "matrix" = {. <- unique(df$x)
  i <- match(df$x, .)
  nc <- length(.)
  nr <- length(i)
  cbind(df, matrix(`[<-`(integer(nc * nr), 1:nr + nr * (i - 1), 1), nr, nc,
                   dimnames=list(NULL, .)))}

, "outer" = {. <- unique(df$x)
  cbind(df, +outer(df$x, setNames(., .), `==`))}

, "rep" = {. <- unique(df$x)
  n <- nrow(df)
  cbind(df, +matrix(df$x == rep(., each=n), n, dimnames=list(NULL, .)))}
)

结果

Unit: milliseconds
      expr       min        lq      mean    median        uq       max neval
      nnet  208.6898  220.2304  326.2210  305.5752  386.3385  541.0621    10
 contrasts 1110.0123 1168.7651 1263.5357 1216.1403 1357.0532 1514.4411    10
        ==  146.2217  156.8141  208.2733  185.1860  275.3909  278.8497    10
  ==Sapply  290.0458  291.4543  301.3010  295.0557  298.0274  358.0531    10
    matrix  302.9993  304.8305  312.9748  306.8981  310.0781  363.0773    10
     outer  524.5230  583.5224  603.3300  586.3054  595.4086  807.0260    10
       rep  276.2110  285.3983  389.8187  434.2754  435.8607  442.3403    10

1

using data.table

library(data.table)
setDT(df) #make df a data.table if needed 

merge(df, dcast(df, n ~ x, fun.agg = length), by = c("n"))

网页内容由stack overflow 提供, 点击上面的
可以查看英文原文,
原文链接