有没有适用于R的曲线拟合资源?我发现了https://systatsoftware.com/products/sigmaplot/product-uses/sigmaplot-products-uses-curve-fitting-using-sigmaplot/
是否有类似的推荐或库在R中可用?
谢谢!
有没有适用于R的曲线拟合资源?我发现了https://systatsoftware.com/products/sigmaplot/product-uses/sigmaplot-products-uses-curve-fitting-using-sigmaplot/
是否有类似的推荐或库在R中可用?
谢谢!
你好,R中有不只一种方法可以进行曲线拟合。你可以从以下简单的方法开始:
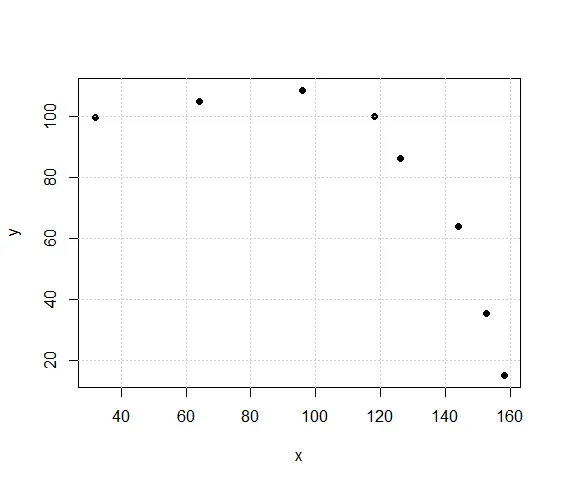
x <- c(32,64,96,118,126,144,152.5,158)
#make y as response variable
y <- c(99.5,104.8,108.5,100,86,64,35.3,15)
plot(x,y,pch=19)
这将为您提供下面的图形。通过直观观察曲线,我们可以适合一些漂亮的多项式曲线。
linMod <- lm(y~x)
#second degree polynomial model
linMod2 <- lm(y~poly(x,2,raw=TRUE))
#third degree polynomial model
linMod3 <- lm(y~poly(x,3,raw=TRUE))
#fourth degree polynomial model
linMod4 <- lm(y~poly(x,4,raw=TRUE))
#generate new data in range of 50 numbers starting from 30 and ending at 160
newData <- seq(30,160, length=50)
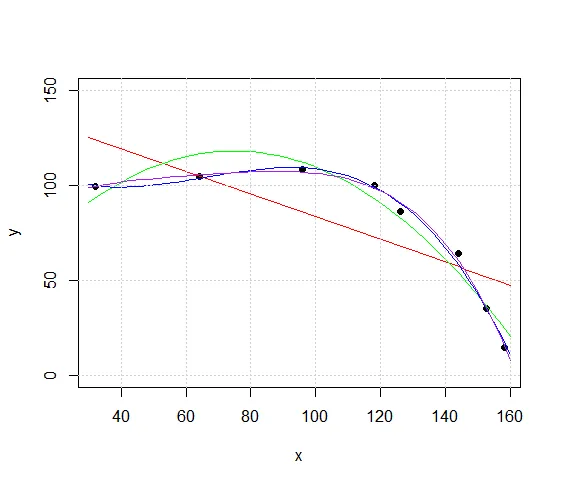
plot(x,y,pch=19,ylim=c(0,150))
lines(newData, predict(linMod, data.frame(x=newData)), col="red")
lines(newData, predict(linMod2, data.frame(x=newData)), col="green")
lines(newData, predict(linMod3, data.frame(x=newData)), col="blue")
lines(newData, predict(linMod4, data.frame(x=newData)), col="purple")