我正在尝试在循环中在同一行绘制几个带有次要y轴的图。我希望它们只有一个主要y轴位于第一个图的左侧,只有一个次要y轴位于最后一个图的右侧。到目前为止,我通过子图的sharey = True属性成功实现了第一件事,但是我在次要轴方面遇到了麻烦。
for r in df.Category1.sort_values().unique():
dfx = df[df['Category1'] == r]
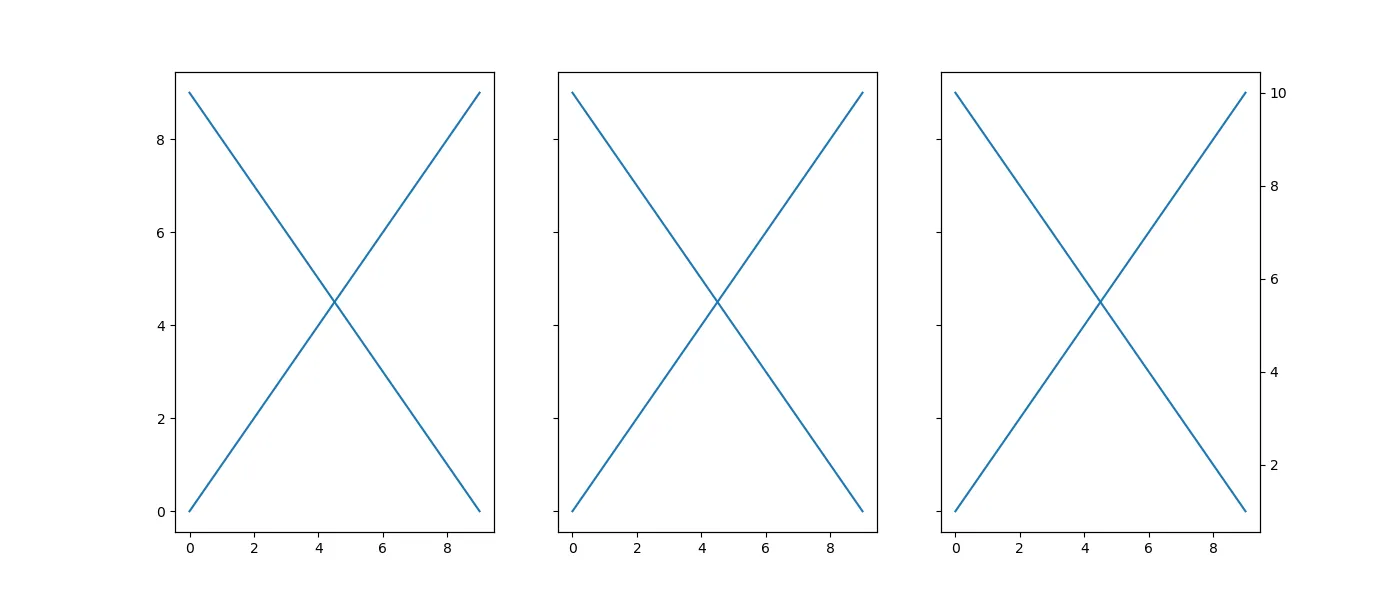
fig, axes = plt.subplots(1,3, figsize = (14,6), sharey=True)
for (n, dfxx), ax in zip(dfx.groupby("Category2"), axes.flat):
ax1 = sns.barplot(x = dfxx['Month'], y = dfxx['value1'], hue = dfxx['Category3'], ci = None, palette = palette1, ax=ax)
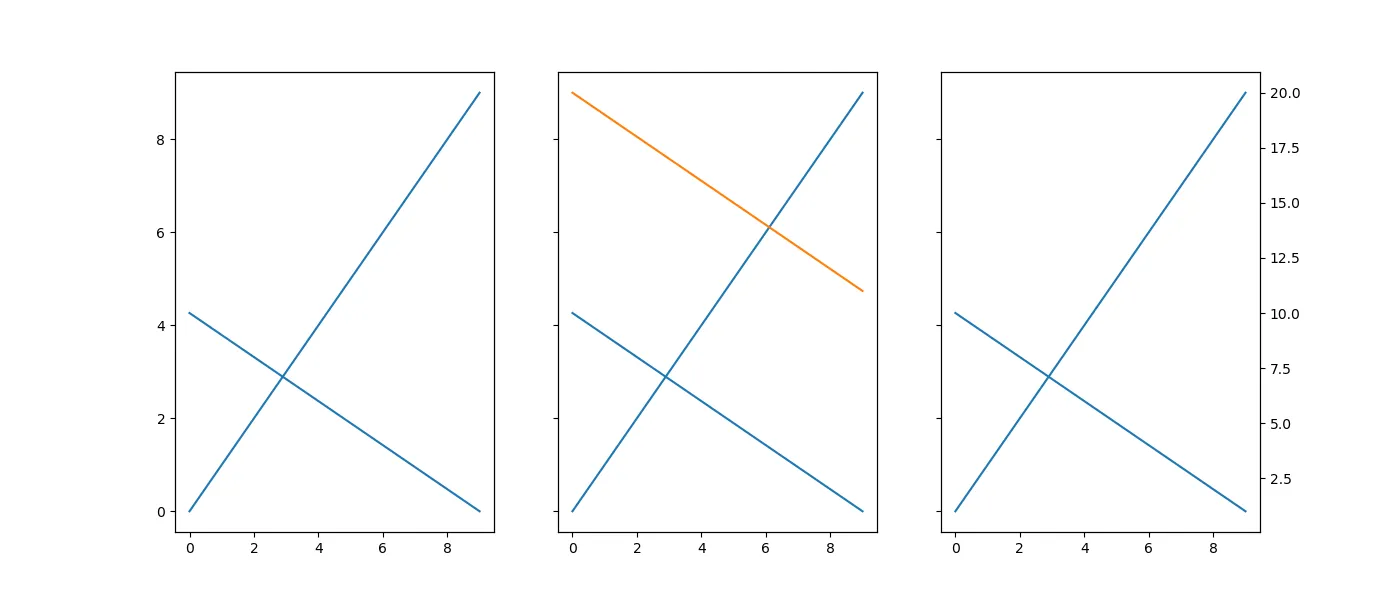
ax2 = ax1.twinx()
ax2 = sns.pointplot(x = dfxx['Month'], y=dfxx['value2'], hue = dfxx['Category3'], ci = None, sort = False, legend = None, palette = palette2)
plt.tight_layout()
plt.show()
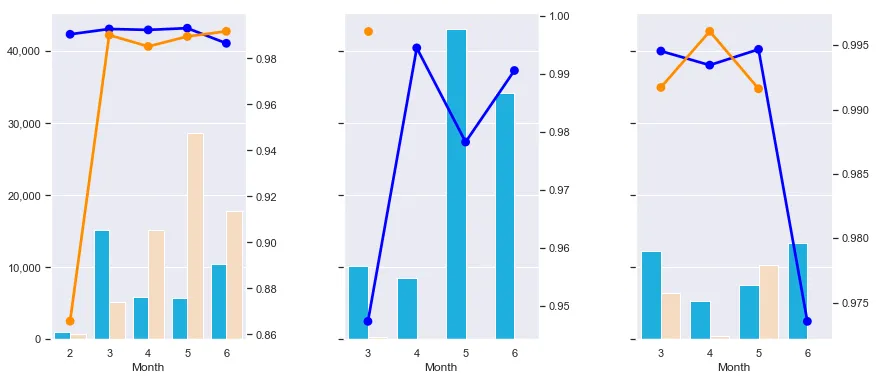
正如您所看到的,在循环的一次迭代中,它只有一个主要的左侧y轴,但是每个图都会出现次要y轴,我希望它对于所有的图表都是一致的,并且仅在最右边的图表中出现一次。