有没有办法在模拟器中检查Flutter应用程序元素? 我正在使用VS Code而不是Android Studio,我想从运行的模拟器中检查元素。
Flutter Inspector 在 Visual Studio Code 中
44
- Asmaa3107
1
1请关注此开放的 问题。 - Raouf Rahiche
9个回答
51
- Evandro Pomatti
11
在Flutter项目中检查Widget:
1- 打开命令面板(Ctrl+Shift+P(macOS上为Cmd+Shift+P))。
2- 选择Flutter:检查Widget命令并按Enter键。
3- 在模拟器中点击任意widget。
4- 查看widget树形结构。
5- 祝你好运。
- Tofiq Samali
5
我使用快捷键:Ctrl+Alt+D(在 Ubuntu + VSCode 中)。
不要忘记应用程序必须已经在调试模式下运行,就像 Evandro 提到的那样。
- Tom O
4
在运行应用程序时,出现热重载后,请在终端中按“i”。还有一些其他功能。要查找它,请在终端中按“h”。
- Mohammed Alukkal
3
实际上,当你在运行 flutter run 后在终端中输入 h,你会得到所有这些内容;
Flutter run key commands.
r Hot reload.
R Hot restart.
h Repeat this help message.
d Detach (terminate "flutter run" but leave application running).
c Clear the screen
q Quit (terminate the application on the device).
s Save a screenshot to flutter.png.
b Toggle the platform brightness setting (dark and light mode).          (debugBrightnessOverride)
w Dump widget hierarchy to the console.                                             (debugDumpApp)
t Dump rendering tree to the console.                                        (debugDumpRenderTree)
L Dump layer tree to the console.                                             (debugDumpLayerTree)
S Dump accessibility tree in traversal order.                                 (debugDumpSemantics)
U Dump accessibility tree in inverse hit test order.                          (debugDumpSemantics)
i Toggle widget inspector.                                (WidgetsApp.showWidgetInspectorOverride)
I Toggle oversized image inversion ️.                               (debugInvertOversizedImages)
p Toggle the display of construction lines.                                (debugPaintSizeEnabled)
o Simulate different operating systems.                                    (defaultTargetPlatform)
z Toggle elevation checker.
g Run source code generators.
M Write SkSL shaders to a unique file in the project directory.
v Launch DevTools.
P Toggle performance overlay.                                  (WidgetsApp.showPerformanceOverlay)
a Toggle timeline events for all widget build methods.                  (debugProfileWidgetBuilds)
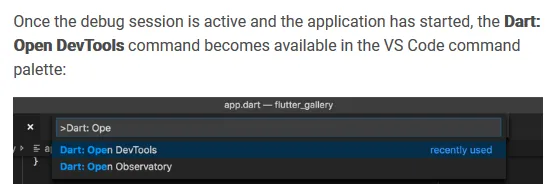
为了直接在浏览器中打开 DevTool,你可以输入
v。结果会像这样:
- Asyraf
1
今天这种说法并不正确。请编辑答案或更新步骤,以便为 OP 提供准确的指导建议。 - Gel
1
关闭小部件检查器
VS Code Windows Ctrl+Shift+p -> Flutter: 取消小部件检查 MacOS Cmd+Shift+p -> Flutter: 取消小部件检查
VS Code Windows Ctrl+Shift+p -> Flutter: 取消小部件检查 MacOS Cmd+Shift+p -> Flutter: 取消小部件检查
- Furkan Cetintas
1
打开检查器后,这就是我在寻找的命令。谢谢。 - undefined
1
更新的方法:
Android Studio有一个Flutter Inspector,VS Code也有类似的称为Widget Inspector。
截至Dart Code(VS Code扩展)版本2.24.0,“Flutter: Inspect Widget”命令已被DevTools替换。(在撰写本文时,最新版为3.36.0。要从命令面板中访问Inspect Widget,需执行多个步骤。)
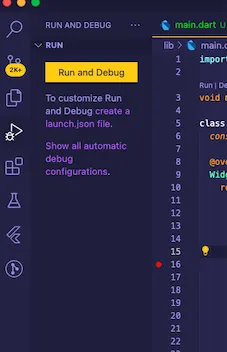
在使用模拟器时快速打开Widget Inspector的方式是以调试模式运行Flutter应用程序。
Click the debug (bug) button from the side menu and Select Run and Debug or press f5
Widget检查器将自动打开。
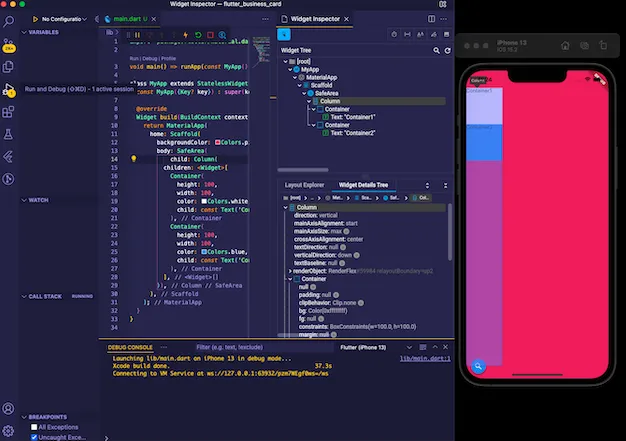
 Flutter Widget检查器使用模拟器的屏幕截图
- Sharon Atim
1
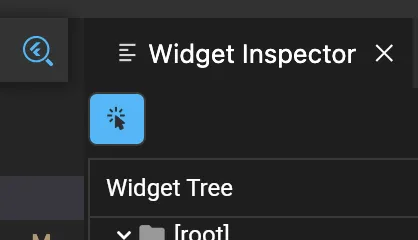
除了 Evandro Pomatti 的答案,您还可以点击 "选择小部件模式" 按钮来切换选择开/关:
- Bjørn Egil
网页内容由stack overflow 提供, 点击上面的可以查看英文原文,
原文链接
原文链接
- 相关问题
- 9 Flutter Inspector在Visual Studio Code中出现故障/冻结。
- 3 Flutter在Visual Studio Code中未显示颜色板。
- 14 Flutter: Visual Studio Code中的热重载卡住了
- 4 Flutter如何更改Visual Studio Code的“Wrap with…”顺序
- 13 Flutter,Visual Studio Code项目卡在“分析”上
- 5 从Visual Studio Code运行所有Flutter单元测试
- 135 如何为Flutter模拟器设置Visual Studio Code设备
- 7 如何在Visual Studio Code中使用Flutter的Widget Inspector?
- 10 无法在Visual Studio Code中找到Flutter Inspector / 切换调试画面
- 16 Visual Studio Code 取代 Visual Studio