我如何增加这张图片的大小?
这并没有起作用:
fig.figsize(15, 15)
fig.figsize(15, 15)
.set_figwidth和.set_figheight在matplotlib.figure.Figure对象上使用,该对象由plt.subplots()返回,或者使用f.set_size_inches(w, h)同时设置宽度和高度:f.set_figheight(15)
f.set_figwidth(15)
.subplots()创建一个新的图形时,可以指定figsize=参数:f, axs = plt.subplots(2, 2, figsize=(15, 15))
.subplots接受**fig_kw参数,这些参数会传递给pyplot.figure函数,并且可以在其中找到figsize。
fig.set_size_inches可以同时设置高度和宽度。 - Francesco Montesano**fig_kw部分,这些参数将传递给pyplot.figure。 - Rutger Kassies除了之前的答案,这里有一种选项可以通过 gridspec_kw 来单独设置图形的大小和子图在图形中的大小:
import matplotlib.pyplot as plt
import numpy as np
import pandas as pd

#generate random data
x,y=range(100), range(10)
z=np.random.random((len(x),len(y)))
Y=[z[i].sum() for i in range(len(x))]
z=pd.DataFrame(z).unstack().reset_index()

#Plot data
fig, axs = plt.subplots(2,1,figsize=(16,9), gridspec_kw={'height_ratios': [1, 2]})
axs[0].plot(Y)
axs[1].scatter(z['level_1'], z['level_0'],c=z[0])
以此数字为结果: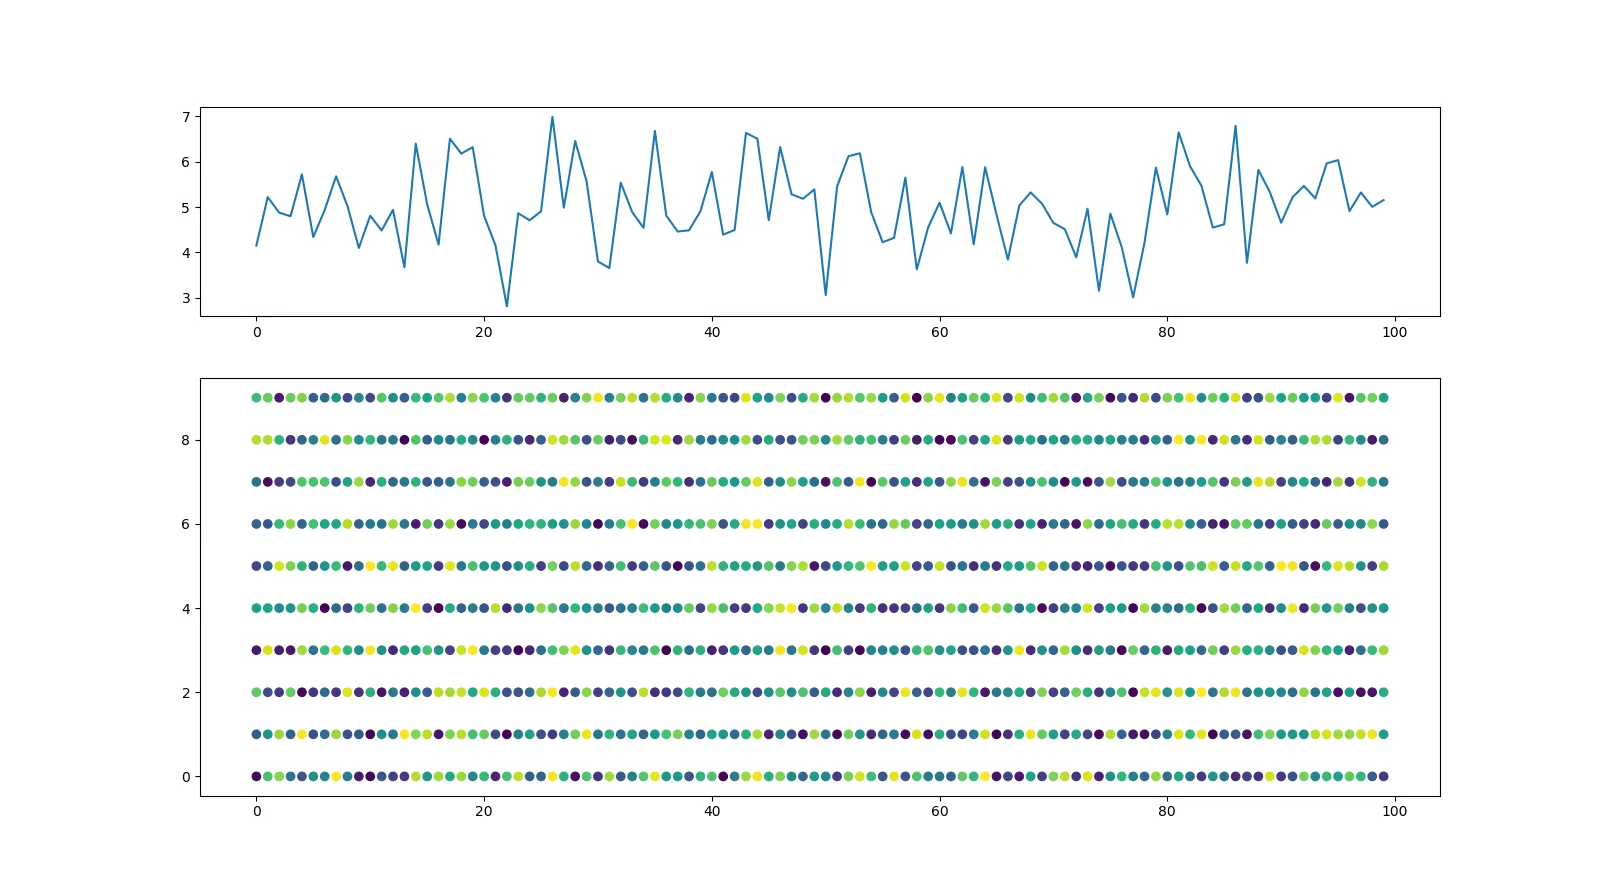
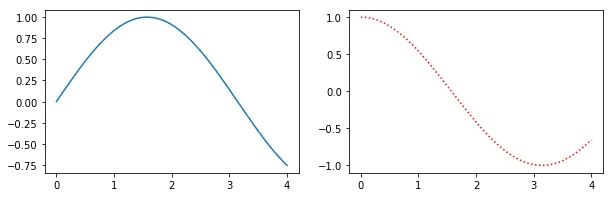
或者,使用figsize参数创建figure()对象,然后使用add_subplot添加子图。例如:
import matplotlib.pyplot as plt
import numpy as np

f = plt.figure(figsize=(10,3))
ax = f.add_subplot(121)
ax2 = f.add_subplot(122)
x = np.linspace(0,4,1000)
ax.plot(x, np.sin(x))
ax2.plot(x, np.cos(x), 'r:')
使用这种方法的好处在于其语法更接近于调用subplot()而不是subplots()。例如,subplots()似乎不支持使用GridSpec来控制子图之间的间距,但是subplot()和add_subplot()都支持。
要改变单个图的尺寸以及最多两个子图的尺寸,您可以使用plt.figure(figsize=(16,8))。(figsize参数允许修改图形的大小)
如果要更改多个子图的尺寸,则在创建子图时可以使用plt.subplots(2,2,figsize=(10,10))。
有时候,在循环中绘制subplots是很有用的,下面是一个示例代码,使用matplotlib绘制多个直方图子图,数据源为multivariate numpy array(二维数组)。
plt.figure(figsize=(16, 8))
for i in range(1, 7):
    plt.subplot(2, 3, i)
    plt.title('Histogram of {}'.format(str(i)))
    plt.hist(x[:,i-1], bins=60)
   from matplotlib import pyplot as plt
   lis=[img,gaussian_img,gaussian_img_8bit]
   f,axs=plt.subplots(3,1,figsize=(25,25)) #ROW,COLUMN
   axs[0].imshow(lis[0])
   axs[1].imshow(lis[1])
   axs[2].imshow(lis[2])
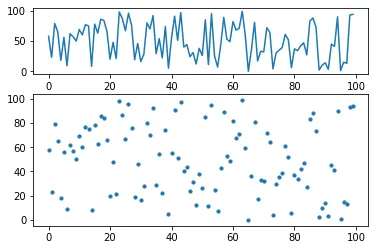
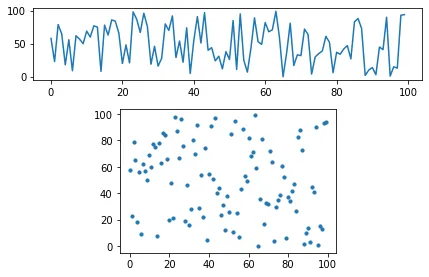
height_ratios/width_ratios传递给plt.subplots,而不是通过gridspec_kw。因此,可以按照以下方式设置相对高度。import matplotlib.pyplot as plt
import random
data = random.sample(range(100), k=100)
fig, axs = plt.subplots(2, figsize=(6,4), height_ratios=[1, 2])
# ^^^^^^^^^ <---- here
axs[0].plot(data)
axs[1].scatter(range(100), data, s=10);
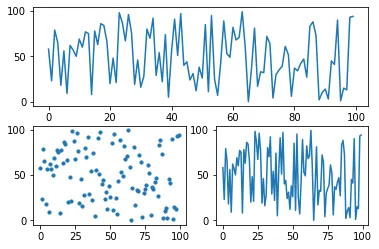
matplotlib.gridspec.GridSpec,但更简单的方法是将适当的位置传递给add_subplot()调用。在下面的示例中,首先绘制了一个2x1布局中的第一个子图。然后,不是在2x1布局的第二个子图中绘制,而是初始化一个2x2布局,但在其第三个子图中绘制(此布局中前两个子图的空间已被顶部图占据)。fig = plt.figure(figsize=(6, 4))
ax1 = fig.add_subplot(2, 1, 1) # initialize the top Axes
ax1.plot(data) # plot the top graph
ax2 = fig.add_subplot(2, 2, 3) # initialize the bottom left Axes
ax2.scatter(range(100), data, s=10) # plot the bottom left graph
ax3 = fig.add_subplot(2, 2, 4) # initialize the bottom right Axes
ax3.plot(data) # plot the bottom right graph
最后,如果需要创建一个自定义尺寸的子图,一种方法是在图形对象上调用add_axes()函数并传递(left, bottom, width, height)的信息。
fig = plt.figure(figsize=(6,4))
ax1 = fig.add_axes([0.05, 0.6, 0.9, 0.25])  # add the top Axes
ax1.plot(data)                              # plot in the top Axes
ax2 = fig.add_axes([0.25, 0, 0.5, 0.5])     # add the bottom Axes
ax2.scatter(range(100), data, s=10);        # plot in the bottom Axes
height_ratios/width_ratios,而.add_subplot已经在这个回答中涵盖了。这个问题是特定于问题中提供的链接。 - Trenton McKinneyfig, axs = plt.subplots(2, figsize=(6,4))已经在接受的答案中涵盖了。因此,这实际上是一个重复的答案,并且包含与现有问题无关的额外信息。总体而言,您的回答通常都很好,继续专注于回答原始问题,不要创建重复的答案,或者利用一个问题来回答另一个问题。有时候,如果能改进的话,更新现有的答案会更好。 - Trenton McKinney