如何在R Studio演示文稿(Rpres)中包含plotly?

15

如何在Rpres文件中包含plotly图表?如果像普通的Rmd文件一样处理它

Basic Plot
========================================================
```{r, echo=FALSE}
library(plotly)
plot_ly(economics, x = date, y = unemploy / pop)
```
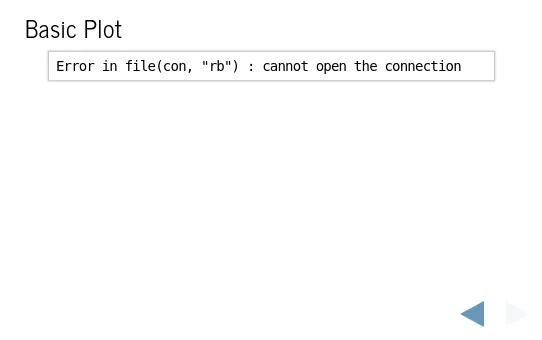
结果如下所示:Error in file(con, "rb") : cannot open the connection 我想到的解决方案是利用Markdown可以包含HTML标签的特性。
Basic Plot
========================================================
```{r, results='hide', echo=FALSE}
library(plotly)
p = plot_ly(economics, x = date, y = unemploy / pop)
htmlwidgets::saveWidget(as.widget(p), file = "demo.html")
```
<iframe src="demo.html" style="position:absolute;height:100%;width:100%"></iframe>

但我希望有一种更加优雅的解决方案,不需要使用任何额外的文件。


不错的解决方法,谢谢。另外,使用Rmarkdown渲染的ioslides也可以很好地使用plotly。 - Antoine Vernet
@Antoine,你能详细说明一下这个工作流程吗? - jakob-r
我已经在下面的答案中添加了一个最简示例,演示如何实现这一点。如果这不是你所想要的,请告诉我。 - Antoine Vernet
2个回答

6
以下是如何在ioslides演示文稿中包含plot_ly图形的最简示例,因此并不完全回答了Rpres的问题,但提供了一种替代方案。
第一张幻灯片显示了一个从ggplot转换为plot_ly的图形,并保留了ggplot样式。 第二张幻灯片直接使用plot_ly显示了一个图形。
---
title: "Plot_ly demo"
date: "8 December 2016"
output: ioslides_presentation
---

```{r setup, include=FALSE}
knitr::opts_chunk$set(echo = FALSE)
```

## A simple plot_ly

```{r, fig.align='center', message = FALSE}
library(plotly)

df <- data.frame(x =  1:10, y = (1:10)^2)

p <- ggplot(df, aes(x = x, y = y)) + geom_line() + labs(x = "X", y = "Y", title = "X and Y")

ggplotly(p)
```

## Another simple plot_ly

```{r, echo = FALSE, fig.align = 'center', message = FALSE}
plot_ly(df, x = x, y = y)
```

-1

遇到了相同的问题。当我执行slidify(index.Rmd)时,出现一条消息,其中包含PhantomJS not found,并建议我运行webshot :: install_phantomjs()。所以我这样做了,错误就消失了。然而,我仍然没有获得plotly交互式地图输出。它是空白的.

还尝试在终端中尝试以下代码,对于某些人有效,但对我无效。我获得了html文件输出,但仍然没有地图。它来自于post。也许对你有用。

Rscript -e "library(knitr); library(rmarkdown); 
rmarkdown::render('index.Rmd', output_file='index.html')"

我确定是 Plotly。因为 ggplot 正常工作。
更新:
运行 install.packages("webshot") 重新安装/更新 webshot 包,然后再次运行 webshot::install_phantomjs(),最后运行library(knitr); library(rmarkdown); rmarkdown::render('index.Rmd', output_file='index.html')。它可以正常工作。html 文件有一个 Plotly 地图,尽管它不会出现在 Knitr 预览窗口中。
更新:
通过添加以下代码,我能够在侧边栏中显示地图。参考这个post
htmlwidgets::saveWidget(as_widget(p), "p.html")
cat('<iframe src="./p.html" width=100% height=100% allowtransparency="true"> </iframe>')
完整的上下文如下所示。

library(plotly)
cities <- readRDS("D:/R/data/cn_cities.rds")
cities <- cities[1:50,]

geo <- list(
  scope = 'asia',
  projection = list(type = 'Mercator'),
  showland = TRUE,
  landcolor = toRGB("gray85"),
  countrycolor = toRGB("white"),
  subunitcolor = toRGB("white"),
  countrywidth = 1,
  subunitwidth = 1)

p <- plot_geo(cities, 
              locationmode='CHN', 
              sizes=c(1, 200)) %>% 
     add_markers(x=~lng, y=~lat, 
                 size=~sqrt(population),
                 hoverinfo="text", 
                 text=~paste(city, "<br />", population)) %>%
     layout(title='', 
            geo=geo)

htmlwidgets::saveWidget(as_widget(p), "p.html")
cat('<iframe src="./p.html" width=100% height=100% allowtransparency="true"> </iframe>')

网页内容由stack overflow 提供, 点击上面的
可以查看英文原文,
原文链接