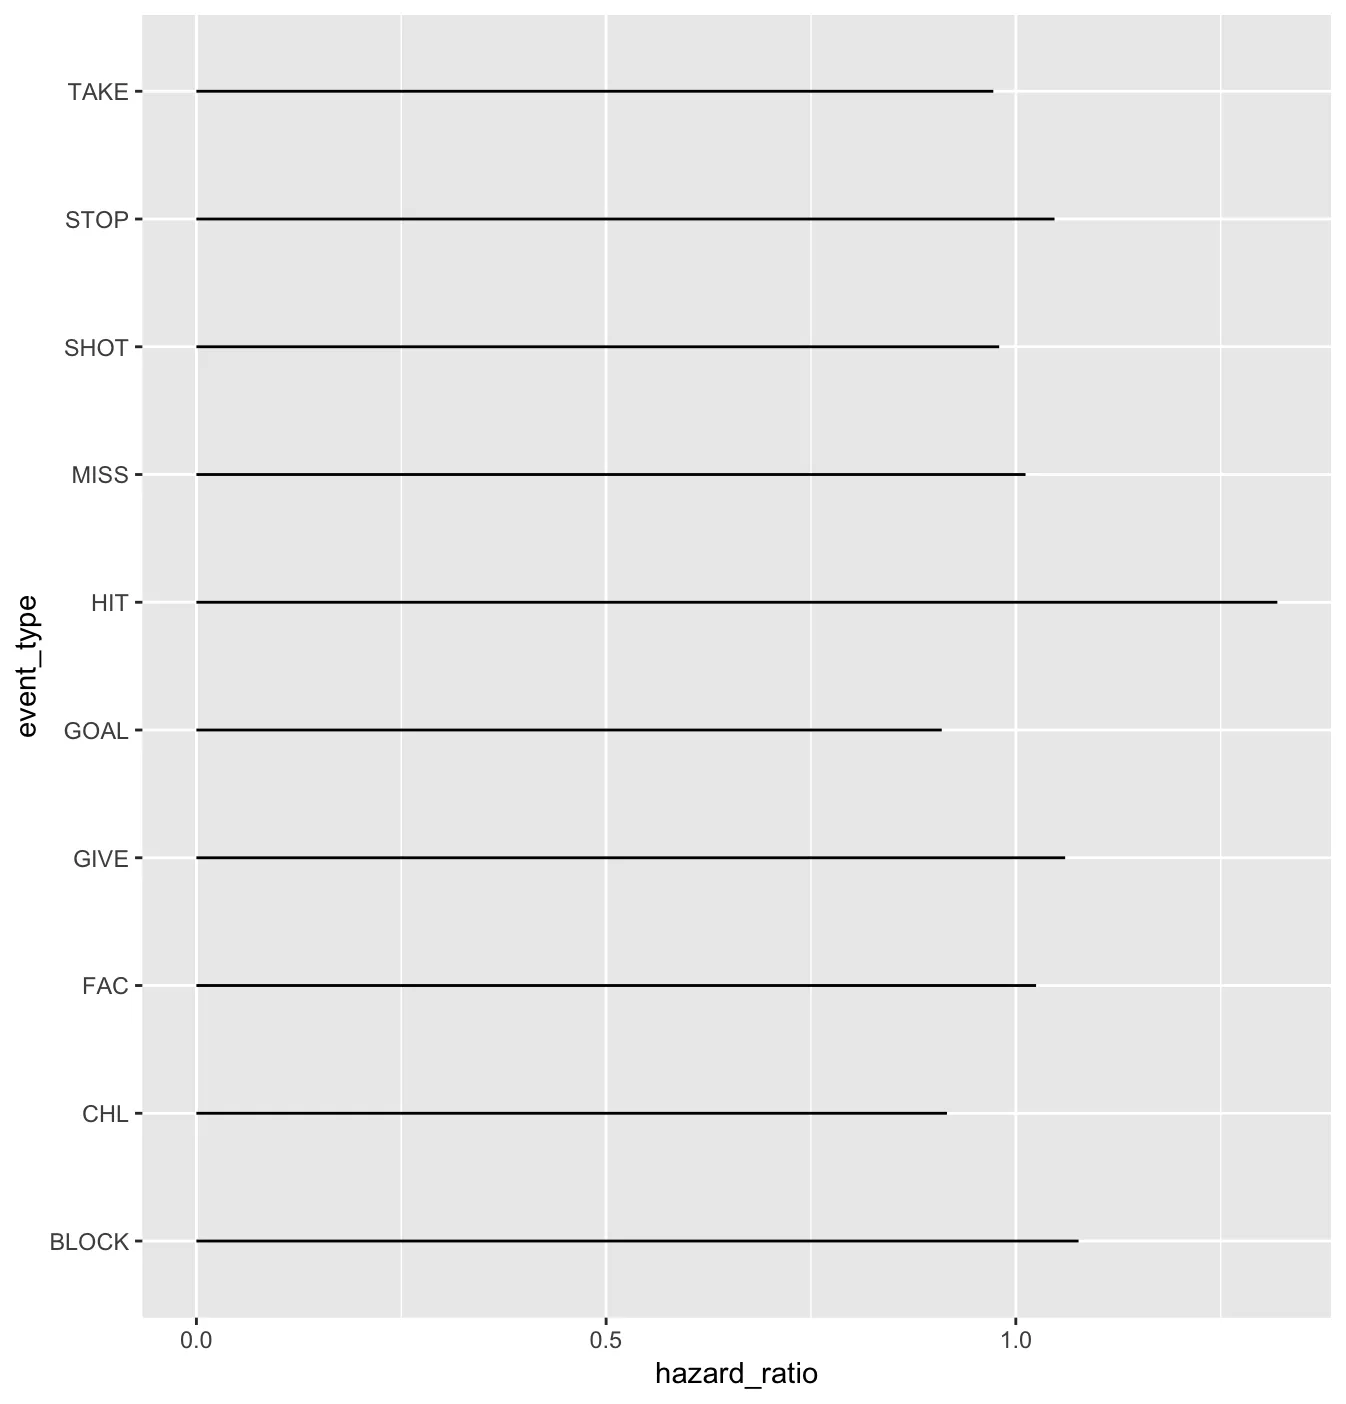
按照另一列重新排序因子列。

9

我有一个称为test的数据帧:

structure(list(event_type = structure(c(5L, 6L, 8L, 3L, 9L, 1L, 
7L, 4L, 10L, 2L), .Label = c("BLOCK", "CHL", "FAC", "GIVE", "GOAL", 
"HIT", "MISS", "SHOT", "STOP", "TAKE"), class = "factor"), hazard_ratio = c(0.909615543020822, 
1.3191464689192, 0.979677208703559, 1.02474605962247, 1.04722377755438, 
1.07656116782136, 1.01186162453814, 1.06021078216577, 0.972520062522276, 
0.915937088175971)), row.names = c(NA, -10L), class = "data.frame")

我想根据 hazard_ratio 重新排序 event_type,但尝试了以下方法未成功...

test %>% 
  mutate(event_type = as.character(event_type),
         event_type = fct_reorder(event_type, hazard_ratio))

1
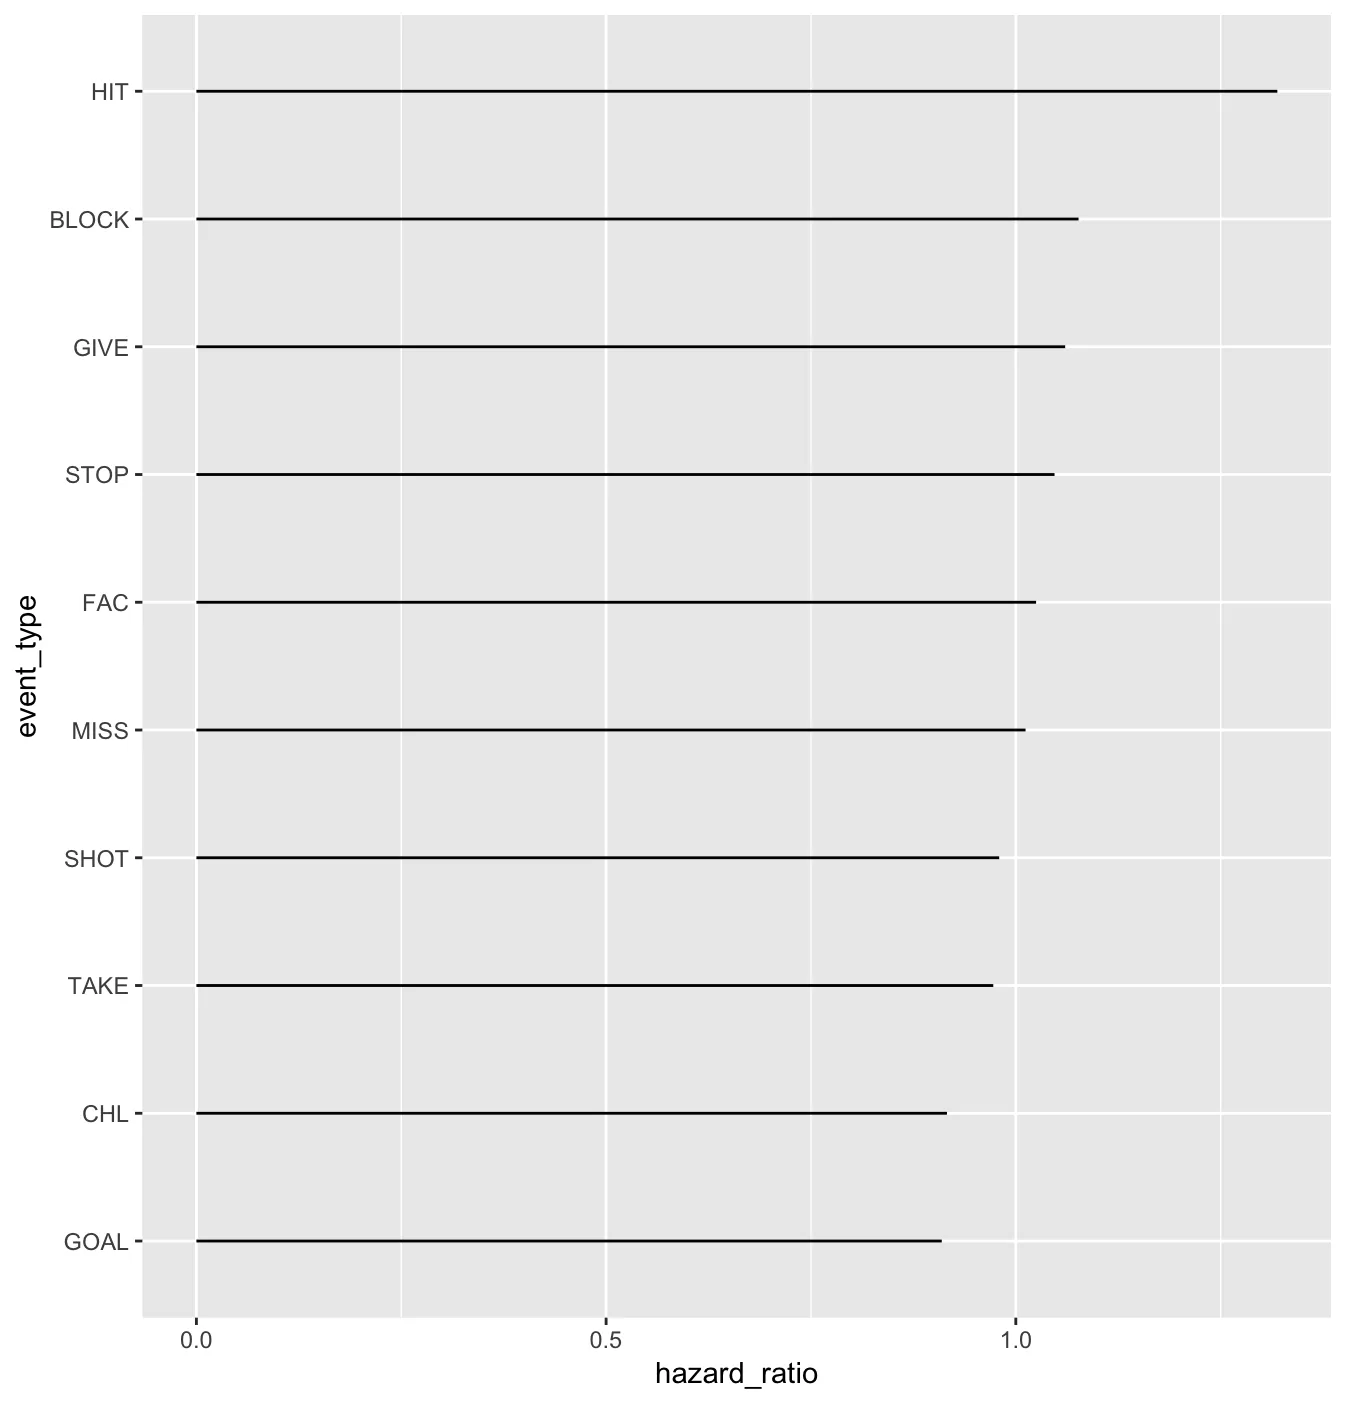
with(test, reorder(event_type, hazard_ratio)) - hrbrmstr
有没有tidyverse的解决方案?哈哈,谢谢。 - user8248672
如果你在使用tidyverse时遇到困难,那么可以使用mutate(test, event_type = fct_reorder(event_type, hazard_ratio, .fun = identity))。请参考fct_reorder的帮助文档,其中.fun被定义为.fun = median - hrbrmstr
1
你可以继续使用tidyverse,但也可以使用好老的base R:mutate(test, event_type = reorder(event_type, hazard_ratio)) - hrbrmstr
1
不,让我们不要这样做。 - hrbrmstr
显示剩余4条评论
1个回答

6

看起来两种方法都可以重新排列因子在我的系统上:

structure(list(event_type = structure(c(5L, 6L, 8L, 3L, 9L, 1L, 
7L, 4L, 10L, 2L), .Label = c("BLOCK", "CHL", "FAC", "GIVE", "GOAL", 
"HIT", "MISS", "SHOT", "STOP", "TAKE"), class = "factor"), hazard_ratio = c(0.909615543020822, 
1.3191464689192, 0.979677208703559, 1.02474605962247, 1.04722377755438, 
1.07656116782136, 1.01186162453814, 1.06021078216577, 0.972520062522276, 
0.915937088175971)), row.names = c(NA, -10L), class = "data.frame") -> test

我们将使用 ggplot2 进行验证,因为它使用 factor 对轴进行排序。

需要翻译的内容:

ggplot(test, aes(hazard_ratio, event_type)) +
  geom_segment(aes(xend=0, yend=event_type))

这里输入图片描述

基础R语言

mutate(test, event_type = reorder(event_type, hazard_ratio)) %>% 
  ggplot(aes(hazard_ratio, event_type)) +
  geom_segment(aes(xend=0, yend=event_type))

在此输入图片描述

forcats

这是一个与R语言相关的包,主要用于处理因子变量。
mutate(test, event_type = fct_reorder(event_type, hazard_ratio, .fun = identity)) %>% 
  ggplot(aes(hazard_ratio, event_type)) +
  geom_segment(aes(xend=0, yend=event_type))

enter image description here


太奇怪了!当我只运行mutate函数而不绘图时,R会显示一个未更改的数据框,但一旦我使用ggplot,它就被排序了。 - user8248672
1
它重新排序了因子。在操作数据框或列之前/之后,使用str()函数查看,您会发现因子已经改变。但它不会重新排列整个数据框,这就是arrange()函数的作用。 - hrbrmstr

网页内容由stack overflow 提供, 点击上面的
可以查看英文原文,
原文链接