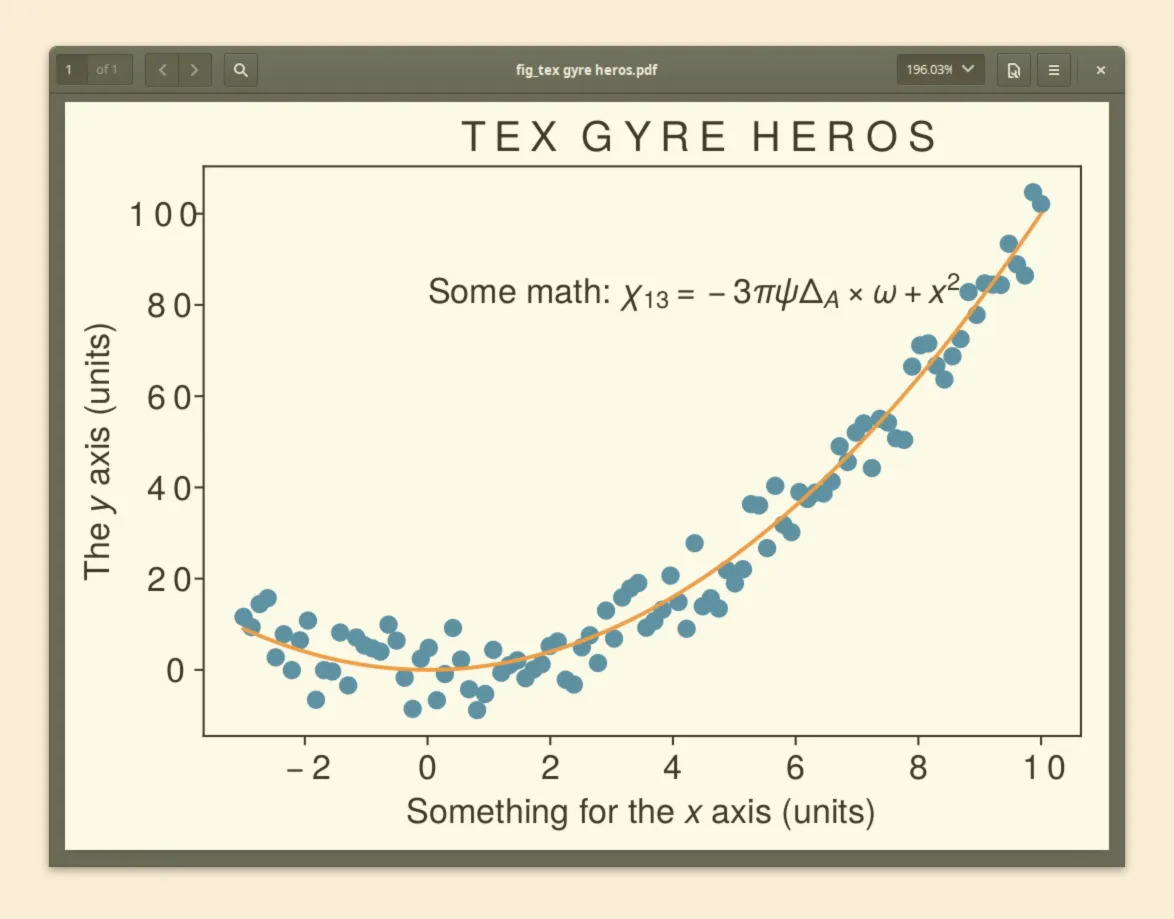
我的目标是在matplotlib图中使用特定字体,例如Nimbus Sans L或Tex Gyre Heros,用于所有文本(常规文本和数学公式)。这两种字体都可用作.otf文件。当我运行下面的代码时,会正确生成png图像,但在pdf中,标题和轴数字的字母之间有额外的空间。似乎将字体大小从默认的10pt更改会产生奇怪的缩放效果。
存在问题的pdf:
我正在使用的工具:matplotlib 2.0.0,python 3.5.2
示例代码:
存在问题的pdf:
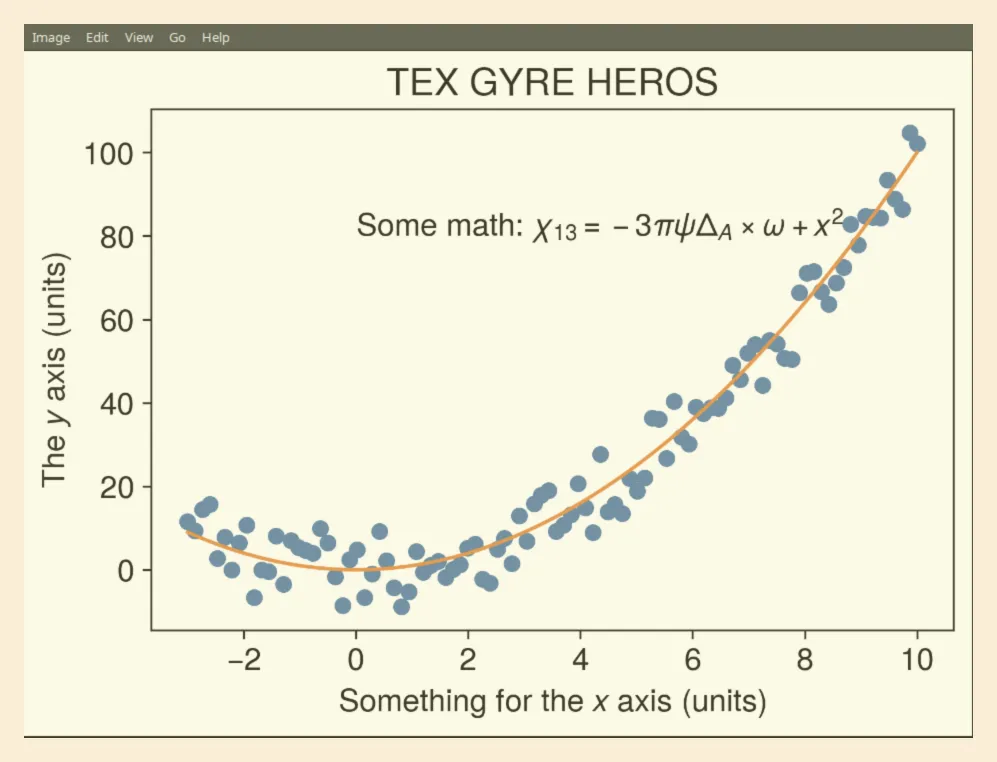
png可以使用:
我正在使用的工具:matplotlib 2.0.0,python 3.5.2
示例代码:
import matplotlib as mpl

import numpy as np
x = np.linspace(-3, 10, 100)
ymodel = x**2
ydata = ymodel + 20 * (np.random.rand(len(x)) - 0.5)

font = 'tex gyre heros'  # an open type font

mpl.rcParams['font.sans-serif'] = font
mpl.rc('mathtext', fontset='custom', it=font + ':italic')
mpl.rc('font', size=13)  # change font size from default 10

import matplotlib.pyplot as plt
plt.figure()
plt.plot(x, ydata, 'o')
plt.plot(x, ymodel)
plt.xlabel("Something for the $x$ axis (units)")
plt.ylabel("The $y$ axis (units)")
plt.title("{}".format(font.upper()))
plt.text(0, 80, "Some math: $\chi_{13}=-3\pi\psi\Delta_A\\times\omega + x^2$")

plt.savefig("fig_" + font.lower() + ".pdf", bbox_inches='tight')
plt.savefig("fig_" + font.lower() + ".png", bbox_inches='tight', dpi=300)