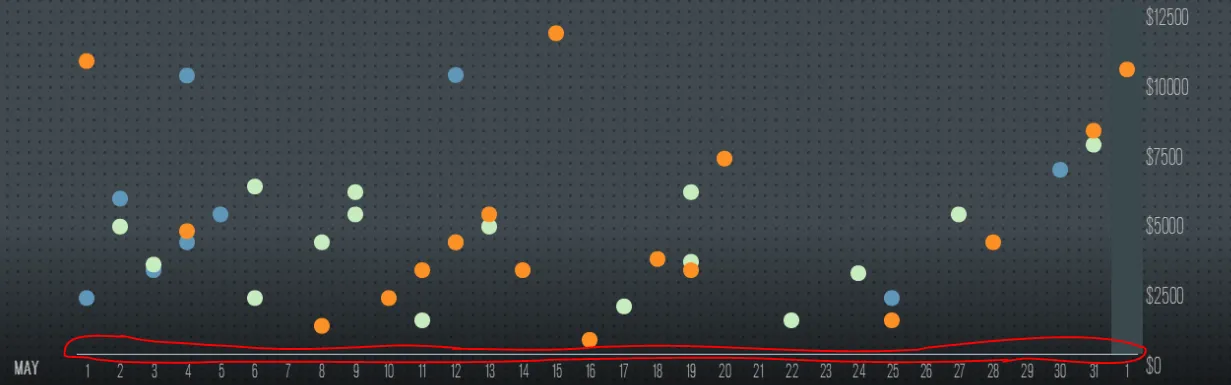
我正在使用Highcharts做我的股票项目。除了x轴底部的网格线无法隐藏外,一切都正常,如下图所示。
更新: 这是JSFiddle link。
我在我的Javascript中有以下属性:
xAxis: {
            type: 'datetime',
            maxZoom: 30 * 24 * 3600000,
            tickInterval: 24 * 3600 * 1000,
            tickLength: 0,
            dateTimeLabelFormats: {
                day: '%e'
            },
            labels: {
                y: 24,
                style: {
                    fontSize: '1.6em',
                    fontWeight: 'normal',
                    fontFamily: 'standardCondensed',
                    color: '#bcbdbd'
                }
            },
            plotLines : [{
                value : (function() {
                        // To Do ...
                    })(),
                color : '#39484d',
                dashStyle : 'solid',
                width : 32,
                label : {
                    text : ''
                }

            }]
        },
        yAxis: {
                title: {
                text:   ''
            },
            opposite: true,
            min: 0,
            plotLines: [{
                value: 0,
                width: 1,
                color:  '#808080'
            }],
            labels: {
                format: '${value}',
                y: 20,
                style: {
                    fontSize: '2em',
                    fontWeight: 'normal',
                    fontFamily: 'standardCondensed',
                    color: '#bcbdbd'
                }
            }
        },
有没有一种方法可以隐藏那条线,但在底部显示月份数字?