在3D图中设置坐标轴限制。

4
我想在matplotlib 3D图中设置轴限制,以摆脱超过15,000的值。
我使用了“set_zlim”,但我的结果出现了一些错误。
我该怎么做?

enter image description here


from mpl_toolkits.mplot3d import Axes3D

fig = plt.figure(figsize=(10, 5))
ax = fig.gca( fc='w', projection='3d')

for hz, freq, z in zip(all_hz, all_freq,all_amp):
    x = hz
    y = freq
    z = z
    
    ax.plot3D(x, y, z)
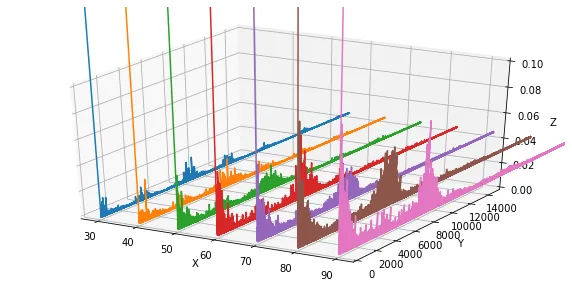
    ax.set_ylim(-10,15000)
    ax.set_zlim(0,0.1)

plt.show()

请帮我理解您的问题。您的一些数据的y值超过15000。通过“设置轴限制”,您是指您不想显示任何y值高于15000的数据点吗? - pakpe
是的,没错。我想要摆脱掉15,000的值。 - Andy_KIM
此问题正在此处跟踪:https://github.com/matplotlib/matplotlib/issues/25804 - undefined
这个回答解决了你的问题吗?在matplotlib中修剪3D图之外的数据 - undefined
2个回答

1

这似乎是工具包中的一个缺陷,由于视角问题导致数据绘制时没有被裁剪到正确的限制范围内。 您可以始终将数据切片到正确的值:

import numpy as np
# define limits
ylim = (-10,15000)
zlim = (0,0.1)

x = hz 
# slicing with logical indexing
y = freq[ np.logical_and(freq >= ylim[0],freq <= ylim[1] ) ]
# slicing with logical indexing
z = z[ np.logical_and(z >= zlim[0],z <= zlim[1] ) ]
    
ax.plot3D(x, y, z)
ax.set_ylim(ylim) # this shouldn't be necessary but the limits are usually enlarged per defailt
ax.set_zlim(zlim) # this shouldn't be necessary but the limits are usually enlarged per defailt

0

set_ylim() 和 set_zlim() 方法只是简单地定义了轴的上下边界,它们不会为您修剪数据。要做到这一点,您必须添加类似以下的条件语句来修剪您的数据:

from mpl_toolkits.mplot3d import Axes3D

fig = plt.figure(figsize=(10, 5))
ax = fig.gca(fc='w', projection='3d')

for hz, freq, z in zip(all_hz, all_freq, all_amp):
    if freq < 15000 and z < 0.1:
        x = hz
        y = freq
        z = z

        ax.plot3D(x, y, z)
        ax.set_ylim(-10, 15000)
        ax.set_zlim(0, 0.1)

plt.show()

网页内容由stack overflow 提供, 点击上面的
可以查看英文原文,
原文链接