这将在图形用户界面中显示图像。
但是我要如何将图像保存到文件中(例如foo.png)呢?
import matplotlib.pyplot as plt
plt.plot([1, 2, 3], [1, 4, 9])
plt.show()
但是我要如何将图像保存到文件中(例如foo.png)呢?
import matplotlib.pyplot as plt
plt.plot([1, 2, 3], [1, 4, 9])
plt.show()
matplotlib.pyplot.savefig 时,文件格式可以通过扩展名指定:from matplotlib import pyplot as plt
plt.savefig('foo.png')
plt.savefig('foo.pdf')
这将分别提供光栅化或矢量化输出。此外,图像周围可能会有不必要的空白,可以通过以下方式去除:
plt.savefig('foo.png', bbox_inches='tight')
plt.savefig()之后再调用plt.show();否则,保存的图片文件将是空白的。savefig()函数后最好加上plt.close(fig)。 - undefined正如其他人所说的那样,plt.savefig() 或 fig1.savefig() 是保存图像的方法。
但是在某些情况下,我发现图形总是显示出来。(例如,使用 Spyder 时有 plt.ion():交互模式=开启。)我通过强制关闭图形窗口来解决这个问题:
plt.close(figure_object)
(参见文档)。这样,在大循环期间我就不会有数百万个打开的图形了。示例用法:
import matplotlib.pyplot as plt
fig, ax = plt.subplots( nrows=1, ncols=1 )  # create figure & 1 axis
ax.plot([0,1,2], [10,20,3])
fig.savefig('path/to/save/image/to.png')   # save the figure to file
plt.close(fig)    # close the figure window
如果需要再次打开图形,请使用 fig.show()(未经过本人测试)。
ax/fig/plt只是示例,您可以随意更改。无论如何,它们都包含对象。您可以在此处查看 subplots 返回的对象:https://matplotlib.org/3.2.1/api/_as_gen/matplotlib.pyplot.subplots.html ,以及这里的pyplot模块:https://matplotlib.org/tutorials/introductory/pyplot.html 。 - Demisplt.close(fig),我的内存从97%(并且内存不足)降低到了60%。真是我太愚蠢了! - undefined解决方案是:
pylab.savefig('foo.png')
matplotib.use(<backend>),例如:import matplotlib
matplotlib.use('Agg')
import matplotlib.pyplot as plt
plt.plot([1,2,3])
plt.savefig('myfig')
plt.show()。然而,Spyder的默认设置仍然会显示图形。参考以下提示来解决这个问题:
https://dev59.com/zWkw5IYBdhLWcg3w1d4m#29931148
我个人更喜欢使用plt.close(fig),因为这样你可以选择隐藏某些图形(在循环中),但仍然可以显示后续数据处理的图形。不过,这可能比选择非交互式后端慢一些 - 如果有人测试过会很有趣。
更新:对于Spyder,通常不能以这种方式设置后端(因为Spyder通常会早期加载matplotlib,阻止您使用matplotlib.use())。plt.switch_backend('Agg'),或者在Spyder首选项中关闭“启用支持”,然后自己运行matplotlib.use('Agg')命令。os.environ ['DISPLAY'] 没有正确设置,使用 .plot() 的另一个后端将会抛出错误。 - economy如果您不喜欢“当前”图形概念,请执行以下操作:
import matplotlib.image as mpimg

img = mpimg.imread("src.png")
mpimg.imsave("out.png", img)
src.png 复制到 out.png? - gerritimg),那么你可以使用.imsave()方法将其保存到文件中。 - wonder.miceimport datetime
import numpy as np
from matplotlib.backends.backend_pdf import PdfPages
import matplotlib.pyplot as plt
# Create the PdfPages object to which we will save the pages:
# The with statement makes sure that the PdfPages object is closed properly at
# the end of the block, even if an Exception occurs.
with PdfPages('multipage_pdf.pdf') as pdf:
plt.figure(figsize=(3, 3))
plt.plot(range(7), [3, 1, 4, 1, 5, 9, 2], 'r-o')
plt.title('Page One')
pdf.savefig() # saves the current figure into a pdf page
plt.close()
plt.rc('text', usetex=True)
plt.figure(figsize=(8, 6))
x = np.arange(0, 5, 0.1)
plt.plot(x, np.sin(x), 'b-')
plt.title('Page Two')
pdf.savefig()
plt.close()
plt.rc('text', usetex=False)
fig = plt.figure(figsize=(4, 5))
plt.plot(x, x*x, 'ko')
plt.title('Page Three')
pdf.savefig(fig) # or you can pass a Figure object to pdf.savefig
plt.close()
# We can also set the file's metadata via the PdfPages object:
d = pdf.infodict()
d['Title'] = 'Multipage PDF Example'
d['Author'] = u'Jouni K. Sepp\xe4nen'
d['Subject'] = 'How to create a multipage pdf file and set its metadata'
d['Keywords'] = 'PdfPages multipage keywords author title subject'
d['CreationDate'] = datetime.datetime(2009, 11, 13)
d['ModDate'] = datetime.datetime.today()
plt.close() 正是我正在寻找的! - Eenoku我使用了以下内容:
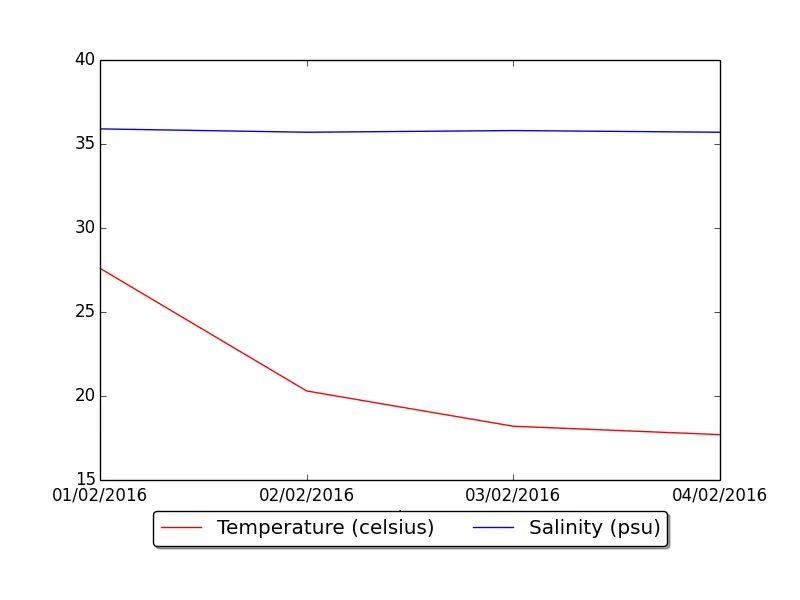
import matplotlib.pyplot as plt

p1 = plt.plot(dates, temp, 'r-', label="Temperature (celsius)")
p2 = plt.plot(dates, psal, 'b-', label="Salinity (psu)")
plt.legend(loc='upper center', numpoints=1, bbox_to_anchor=(0.5, -0.05),        ncol=2, fancybox=True, shadow=True)

plt.savefig('data.png')
plt.show()
plt.close()
我发现在保存图像后使用plt.show非常重要,否则它不起作用。以png格式导出的图像
其他答案都是正确的。但有时我会发现自己想要稍后打开这个图像对象。例如,我可能想要更改标签大小、添加网格或进行其他处理。在完美的世界中,我只需重新运行生成绘图的代码,并调整设置即可。但遗憾的是,世界并不完美。因此,除了保存为PDF或PNG,我还会添加:
with open('some_file.pkl', "wb") as fp:
    pickle.dump(fig, fp, protocol=4)
像这样,我以后可以加载图形对象并根据自己的需要操纵设置。
我还会将每个函数/方法的堆栈与源代码和 locals() 字典一起写出,以便我以后可以准确地判断是什么生成了图形。
NB: 注意,有时这种方法会生成巨大的文件。
使用plot()和其他函数创建所需内容后,您可以使用此语句在绘制时选择输出到屏幕或文件:
import matplotlib.pyplot as plt

fig = plt.figure(figsize=(4, 5))       # size in inches
# use plot(), etc. to create your plot.

# Pick one of the following lines to uncomment
# save_file = None
# save_file = os.path.join(your_directory, your_file_name)

if save_file:
    plt.savefig(save_file)
    plt.close(fig)
else:
    plt.show()
fig = plt.figure(figuresize=4, 5) 可以改为 fig = plt.figure(figsize=(4, 5)) #figure sizes in inches。 - user如果像我一样使用Spyder IDE,您需要使用以下命令禁用交互模式:
plt.ioff()
(此命令将随科学启动自动启动)
如果要重新启用它,请使用:
plt.ion()
plt.close(fig),在大循环中尤其重要。否则,图形将保持打开状态并等待内存,而所有打开的图形都将在执行plt.show()时显示出来。 - timctran