我有一个Python脚本,怀疑存在死锁。我尝试使用pdb进行调试,但如果我逐步执行,它不会出现死锁,并且通过返回的输出可以看到它没有在同一次迭代中被挂起。我希望只在脚本被锁定时将其附加到调试器上,这可能吗?如果需要,我可以使用其他调试器。
使用pdb附加进程
74
- Hola Soy Edu Feliz Navidad
4
1可能会有所帮助 http://code.activestate.com/recipes/577334-how-to-debug-deadlocked-multi-threaded-programs/ - pavel_form
可能会有帮助 https://dev59.com/6HVC5IYBdhLWcg3w-WOs#2569696 - shx2
既然您接受了我的答案,我又仔细研究了一下。如果您还感兴趣,我又想到了几个选项,并添加到了我的答案中。请看“条件断点和循环”部分。 - skrrgwasme
有关 https://wiki.python.org/moin/DebuggingWithGdb 的程序开发内容。 - Trevor Boyd Smith
5个回答
76
目前,pdb无法在运行程序时停止并开始调试。但您有几个其他选项:
GDB
您可以使用GDB在C级别进行调试。虽然这比在实际的Python脚本中操作要抽象一些,因为您需要浏览Python的C源代码,但在某些情况下这很有用。这里提供了说明:https://wiki.python.org/moin/DebuggingWithGdb。它们过于复杂,无法在此总结。
第三方扩展和模块
只需搜索“pdb attach process”,就会发现一些项目可以为PDB提供此功能:
Pyringe:https://github.com/google/pyringe
Pycharm:https://blog.jetbrains.com/pycharm/2015/02/feature-spotlight-python-debugger-and-attach-to-process/
Python维基百科上有几种替代方案:https://wiki.python.org/moin/PythonDebuggingTools
针对你的特定用例,我有一些解决方法:
信号
如果您在Unix上,可以使用信号,像这篇博客文章中所述的那样,尝试停止并附加到正在运行的脚本。
这段引用块直接来自链接的博客文章:
Of course pdb has already got functions to start a debugger in the middle of your program, most notably pdb.set_trace(). This however requires you to know where you want to start debugging, it also means you can't leave it in for production code.
But I've always been envious of what I can do with GDB: just interrupt a running program and start to poke around with a debugger. This can be handy in some situations, e.g. you're stuck in a loop and want to investigate. And today it suddenly occurred to me: just register a signal handler that sets the trace function! Here the proof of concept code:
import os
import signal
import sys
import time

def handle_pdb(sig, frame):
    import pdb
    pdb.Pdb().set_trace(frame)

def loop():
    while True:
        x = 'foo'
        time.sleep(0.2)

if __name__ == '__main__':
    signal.signal(signal.SIGUSR1, handle_pdb)
    print(os.getpid())
    loop()
Now I can send SIGUSR1 to the running application and get a debugger. Lovely!
I imagine you could spice this up by using Winpdb to allow remote debugging in case your application is no longer attached to a terminal. And the other problem the above code has is that it can't seem to resume the program after pdb got invoked, after exiting pdb you just get a traceback and are done (but since this is only bdb raising the bdb.BdbQuit exception I guess this could be solved in a few ways). The last immediate issue is running this on Windows, I don't know much about Windows but I know they don't have signals so I'm not sure how you could do this there.
条件断点和循环
如果你没有信号可用,可以将锁或信号量获取包装在一个循环中,递增计数器,并在计数达到非常大的数字时才停止,这样你仍然可以使用PDB。例如,假设你怀疑某个锁是死锁的一部分:
lock.acquire() # some lock or semaphore from threading or multiprocessing
请将其改写为以下方式:
count = 0
while not lock.acquire(False): # Start a loop that will be infinite if deadlocked
    count += 1

    continue # now set a conditional breakpoint here in PDB that will only trigger when
             # count is a ridiculously large number:
             # pdb> <filename:linenumber>, count=9999999999
当计数非常大时,断点应该会被触发(希望)表明死锁已经发生。如果你发现它在锁定对象看起来没有死锁的情况下被触发,那么你可能需要在循环中插入短暂的时间延迟,使其不那么快地增加。您还可以尝试调整断点触发阈值,以便在正确的时间触发它。我示例中的数字是任意的。
另一种变体是不使用PDB,在计数器变得非常大时故意引发异常,而不是触发断点。如果你编写自己的异常类,你可以用它来打包所有本地的信号量/锁状态,并在脚本的顶层捕获它,在退出前打印出来。
文件指示器
您可以使用不依赖于正确计数的死锁循环的另一种方法是写入文件:
import time

while not lock.acquire(False): # Start a loop that will be infinite if deadlocked
    with open('checkpoint_a.txt', 'a') as fo: # open a unique filename
        fo.write("\nHit") # write indicator to file
        time.sleep(3)     # pause for a moment so the file size doesn't explode
现在让您的程序运行一两分钟。停止程序并查看那些“检查点”文件。如果死锁导致您的程序停滞不前,那些写有“hit”字样的文件多次出现表示哪些锁获取是导致死锁的原因。
您可以通过让循环打印变量或其他状态信息而扩展其有用性,而不仅仅是一个常量。例如,您说您怀疑死锁发生在循环中,但不知道它在哪个迭代上。让这个锁定循环转储您的循环控制变量或其他状态信息以确定死锁发生的迭代。
- skrrgwasme
4
1这需要我重写我的应用程序。但是当我的 Python 程序正在运行时,我刚刚搜索了它,并且我想立即进行调试,而不必重新启动。 - Shiplu Mokaddim
1@shiplu.mokadd.im 嗯,是的...你需要添加一些代码来使用我建议的解决方法。但请看我的编辑,有一些第三方工具的建议,也许你可以使用它们代替。 - skrrgwasme
已经安装了
PyCharm,只是想更改 Python logging 模块的日志级别... 等了一两分钟进程才显示为“暂停”,但然后我在调试器中看到了一些变量... 打开代码解释器,粘贴、执行,然后就完成了... 重新启动进程后我的调试日志就出现了! - nmz787在Linux/Ubuntu中失败。 - Yin
16
有一个 pdb 的克隆版,被称为 pdb-clone,可以附加到正在运行的进程。
你只需在主进程的代码中添加 from pdb_clone import pdbhandler; pdbhandler.register(),然后就可以使用 pdb-attach --kill --pid PID 启动 pdb。
- eaglebrain
1
2
ModuleNotFoundError: No module named 'readline' -> python -m pip install readline -> error: this module is not meant to work on Windows -> python -m pip install pyreadline -> AttributeError: module 'signal' has no attribute 'SIGUSR1' - Andry10
您可以使用我的项目madbg。它是一个Python调试器,允许您附加到正在运行的Python程序并在当前终端中进行调试。它类似于
例如,要查看脚本卡在哪里,您可以运行:
pyrasite和pyringe,但支持Python3,不需要gdb,并使用IPython作为调试器(这意味着有颜色和自动完成的pdb)。例如,要查看脚本卡在哪里,您可以运行:
madbg attach <pid>
在调试器 shell 中输入:
bt
- kmaork
6
VSCode支持调试本地运行的Python进程。
如果您没有launch.json文件,只需开始调试(F5),然后您将看到以下选项。
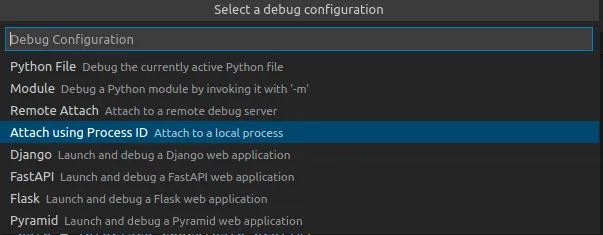
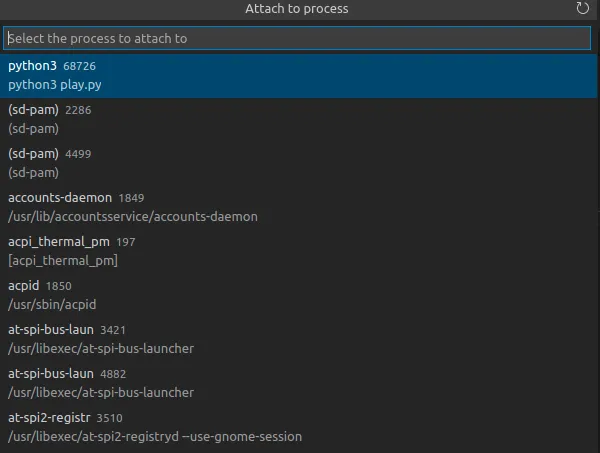
选择“使用进程ID附加”将添加以下内容到您的launch.json中。
  {
  "version": "0.2.0",
  "configurations": [
    {
      "name": "Python: Attach using Process Id",
      "type": "python",
      "request": "attach",
      "processId": "${command:pickProcess}",
    },
}
现在通过这个配置进行调试时,您可以选择要调试的本地Python进程。
- Aidan Gallagher
4
使用pyrasite:
>>> pyrasite 172483 dump_stacks.py
...其中172483是正在运行的Python进程的PID。然后,Python进程将为每个线程打印堆栈跟踪。你可以发送任意Python代码来执行或者打开一个shell。
这对于调试死锁非常有用。你甚至可以在挂起的进程启动后安装pyrasite。但请注意,你应该在相同的环境中安装它才能使其正常工作。
这不是唯一可用的工具,但由于某种原因,它似乎很难无意中发现它。它虽旧,但对于Python 2和3仍然像魔法一样有效。
此工具可能不支持win32,像大多数注入器一样使用unix头文件进行本机C函数,参见例如此开放问题。
- lumbric
网页内容由stack overflow 提供, 点击上面的可以查看英文原文,
原文链接
原文链接