将SVG路径转换为矩形

4
我希望自动生成栅格图像的映射类型结果。我能够提供这张图片作为PNG格式:
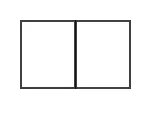
enter image description here 此图像的原始SVG如下:
<svg width="580" height="400" xmlns="http://www.w3.org/2000/svg">
 <g>
  <rect fill="#fff" id="canvas_background" height="402" width="582" y="-1" x="-1"/>
  <g display="none" overflow="visible" y="0" x="0" height="100%" width="100%" id="canvasGrid">
   <rect fill="url(#gridpattern)" stroke-width="0" y="0" x="0" height="100%" width="100%"/>
  </g>
 </g>
 <g>
  <rect id="svg_1" height="67" width="54" y="119.5" x="125.5" stroke-width="1.5" stroke="#000" fill="#fff"/>
  <rect id="svg_3" height="67" width="54" y="119.5" x="180.5" stroke-width="1.5" stroke="#000" fill="#fff"/>
 </g>
</svg>

一旦我使用库进行跟踪:https://github.com/jankovicsandras/imagetracerjs,我会得到这样的路径数据:

<svg width="156" height="114" version="1.1" xmlns="http://www.w3.org/2000/svg" desc="Created with imagetracer.js version 1.2.3" >
    <path fill="rgb(60,60,60)" stroke="rgb(60,60,60)" stroke-width="1" opacity="1" d="M 20 20 L 131 20 L 131 89 L 20 89 L 20 20 Z M 22 22 L 22 87 L 74 87 L 74 22 L 22 22 Z M 77 22 L 77 87 L 129 87 L 129 22 L 77 22 Z " />
    <path fill="rgb(255,255,255)" stroke="rgb(255,255,255)" stroke-width="1" opacity="1" d="M 0 0 L 156 0 L 156 114 L 0 114 L 0 0 Z M 20 20 L 20 89 L 131 89 L 131 20 L 20 20 Z " />
    <path fill="rgb(255,255,255)" stroke="rgb(255,255,255)" stroke-width="1" opacity="1" d="M 22 22 L 74 22 L 74 87 L 22 87 L 22 22 Z " />
    <path fill="rgb(255,255,255)" stroke="rgb(255,255,255)" stroke-width="1" opacity="1" d="M 77 22 L 129 22 L 129 87 L 77 87 L 77 22 Z " />
</svg>

我希望回到rect或多边形方法,这样我就可以测量每个对象的面积,这样如果有追踪文本,我就可以通过说它的总面积低于允许的多边形/矩形对象来排除它/压平它。
是否有一种方法可以将路径数据转换回我有2个单独的对象的地方?我想能够将结果叠加在原始图像上,并允许针对每个正方形进行定位。
1个回答

2
我尽力回答你的问题,但这里有多个解决方案。
如果你强制imagetracerjs仅使用直线边缘(qtres = 0.00001),那么SVG路径元素就是多边形,它们的坐标在d属性中定义:“d =”M 20 20 L 131 20 ...“在第一个示例中。(更多信息:https://developer.mozilla.org/en-US/docs/Web/SVG/Attribute/d) 但是一个d属性通常不只是一个多边形。该形状可能包括孔,它们表示为较小的多边形。(更多信息:https://developer.mozilla.org/en-US/docs/Web/SVG/Attribute/fill-rule
您可以使用正则表达式提取d属性,通过Z标签(大致意思是:这个形状结束了,一个孔形状开始了)将它们分割,然后使用高斯面积公式(https://en.wikipedia.org/wiki/Shoelace_formula)计算坐标以获取面积。您可能需要从父形状的面积中减去孔的面积。
您的图像上有4个单独的对象,但有些不容易处理。我尝试“翻译”您的SVG结果,以便您可以决定要处理哪个路径。 ImageTracer 的输出首先按颜色排序。第一条路径是两个较小矩形周围的黑色边框,技术上这是一个带有两个矩形孔的黑色矩形。第二条路径是黑色边框周围的白色边框,技术上是一个带有一个大矩形孔的白色矩形。第三和第四条路径是较小的白色矩形,这可能对您有用。
有一种替代方法来分割和解析SVG字符串,但不幸的是它有点不被记录。您可以首先获取一个tracedata对象,处理它,然后选择性地将其渲染为SVG字符串。(更多信息:https://github.com/jankovicsandras/imagetracerjs#examples

var options = {qtres:0.0001};

ImageTracer.imageToTracedata(
       'example.png',
       function(tracedata){

           // color layers loop
           for(var i=0; i<tracedata.layers.length; i++){
               // paths loop
               for(var j=0; j<tracedata.layers[i].length; j++){

                   var thispath = tracedata.layers[i][j];

                   // processing this path if it's not a hole
                   if( !thispath.isholepath ){

                       // accumulating coordinates in [ [x,y] , [x,y] , ... ] polygon
                       var thispolygon = [];
                       thispolygon.push( [ thispath.segments[0].x1 , thispath.segments[0].y1 ] );
                       for(var k=0; k<thispath.segments.length; k++){ thispolygon.push( [ thispath.segments[k].x2 , thispath.segments[k].y2 ] ); }

                       // TODO: calculate thispolygon area with https://en.wikipedia.org/wiki/Shoelace_formula here
                   }


               }// End of paths loop
           }// End of color layers loop


       },// End of imageToTracedata callback()

       options

);// End of ImageTracer.imageToTracedata()


希望这些有所帮助。 :)

网页内容由stack overflow 提供, 点击上面的
可以查看英文原文,
原文链接