如何在图像中自动识别多条线?

4

给定一个包含倾斜线条的二进制图像,如何自动识别尽可能多的线条?在Matlab中使用bwtraceboundary函数,我已经能够识别出其中一条,手动提供已识别线条的起始坐标。

有人能指出一种循环矩阵中的1和0以自动识别尽可能多的方法吗?
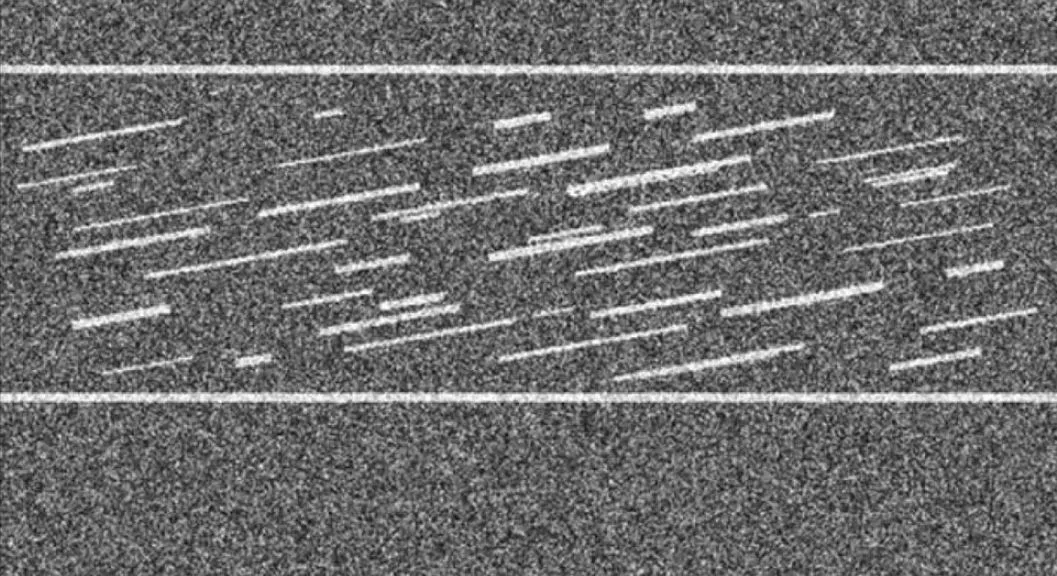
这是一个示例图像:

enter image description here

% Read the image
I = imread('./synthetic.jpg');


figure(1)
BW = im2bw(I, 0.7);
imshow(BW2,[]);
c = 255; % X coordinate of a manually identified line
r = 490; % Y coordinate of a manually identified line
contour = bwtraceboundary(BW,[c r],'NE',8, 1000,'clockwise');
imshow(BW,[]);
hold on;
plot(contour(:,2),contour(:,1),'g','LineWidth',2); 
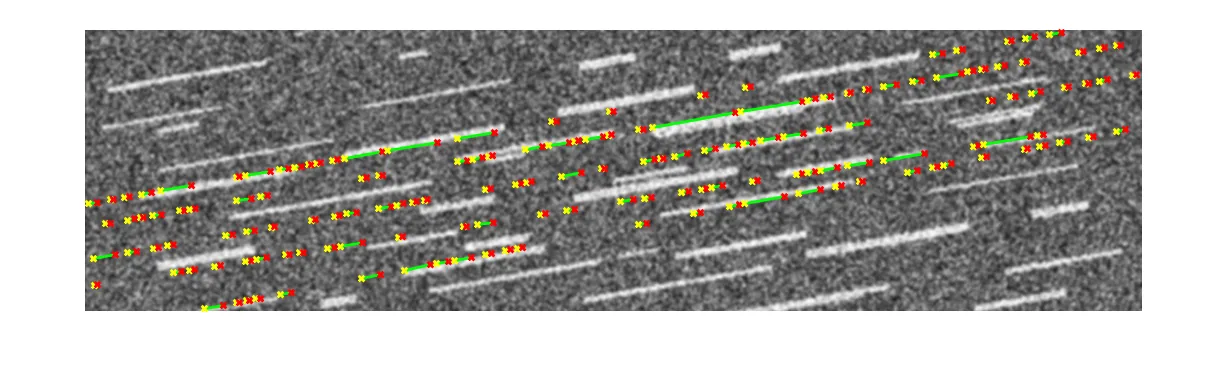
从上面的代码中,我们得到:

enter image description here


6
嗯嗯嗯*!(Hough变换用于直线) - Ander Biguri
能否提供一个最小可重现的示例,使用我提供的图像进行霍夫变换?否则,您能否指向任何有用的信息来源?谢谢。 - AJMA
1
嗯....字面上,“Hough变换线性”在Google上有一个完整的教程,由Mathworks提供,使用houghlines函数.... - Ander Biguri
1个回答

3
这是一个使用MATLAB进行Hough变换检测直线的小例子,对图像进行了一些去噪处理。
此代码并不能检测出所有的直线,您可能需要微调/更改它,并需要一些学习来了解其背后的原理,这超出了StackOverflow的范围。也许有更多知识的人可以找到更好的方法。
I=rgb2gray(imread('https://istack.dev59.com/fTWHh.webp'));

I = imgaussfilt(I,1);
I=I([90:370],:);
BW = edge(I,'canny');
[H,T,R] = hough(BW);
P  = houghpeaks(H,5,'threshold',ceil(0.3*max(H(:))));
lines = houghlines(BW,T,R,P,'FillGap',5,'MinLength',3);

figure, imshow(I), hold on
max_len = 0;
for k = 1:length(lines)
   xy = [lines(k).point1; lines(k).point2];
   plot(xy(:,1),xy(:,2),'LineWidth',2,'Color','green');

   % Plot beginnings and ends of lines
   plot(xy(1,1),xy(1,2),'x','LineWidth',2,'Color','yellow');
   plot(xy(2,1),xy(2,2),'x','LineWidth',2,'Color','red');

   % Determine the endpoints of the longest line segment
   len = norm(lines(k).point1 - lines(k).point2);
   if ( len > max_len)
      max_len = len;
      xy_long = xy;
   end
end

enter image description here


1
谢谢你。这实际上让我完成了一份Codementor合同:P +1。 - rayryeng
@rayryeng,我的钱呢? :P - Ander Biguri

网页内容由stack overflow 提供, 点击上面的
可以查看英文原文,
原文链接