我正在尝试使用leaflet包绘制多边形,但我不明白出了什么问题。
我使用的shapefile可以在这里找到:https://www.data.gouv.fr/en/datasets/fond-de-carte-des-codes-postaux/。
我使用的shapefile可以在这里找到:https://www.data.gouv.fr/en/datasets/fond-de-carte-des-codes-postaux/。
library(leaflet)
library(rgdal)
df <- readOGR("C:/Users/me/codes_postaux","codes_postaux_region")
plot(df)
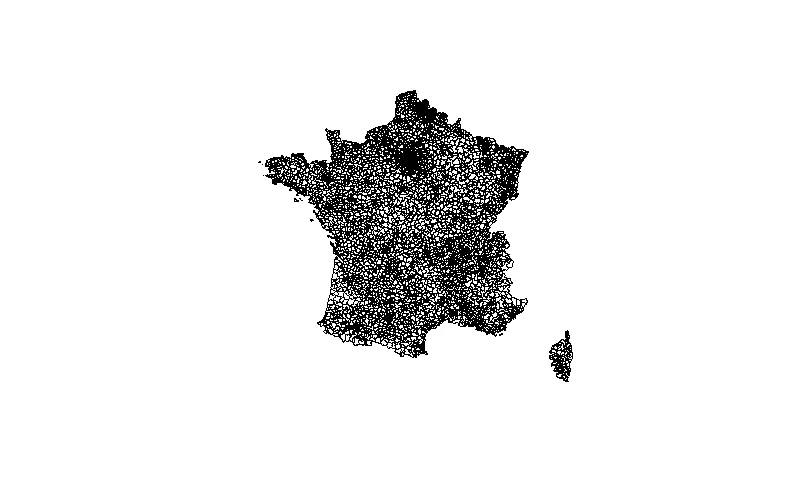
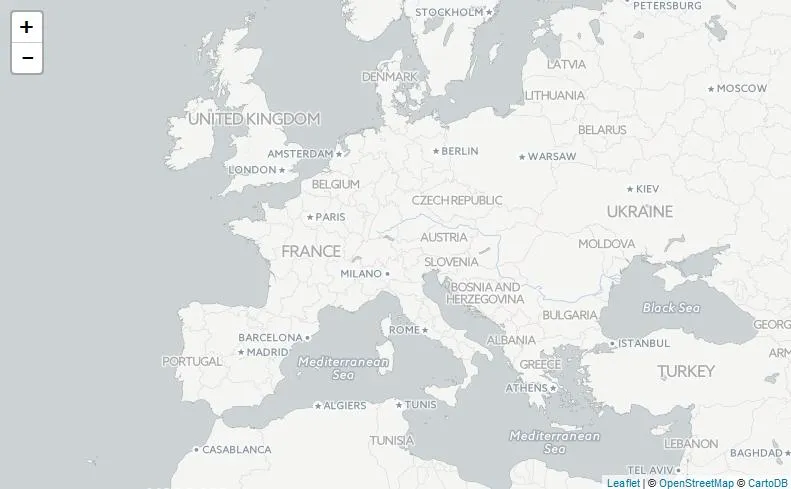
这个shapefile看起来没问题,我使用的代码相当简单。但是我只得到了地图作为输出,没有多边形。我一直在为这个问题苦苦挣扎,如果有人能帮我解决这个问题,我将不胜感激。
map <- leaflet(df) %>%
  addProviderTiles("CartoDB.Positron")%>%
  fitBounds(10,38,10,55) %>%
  addPolygons(fillOpacity = 0.8, color = "Blue", weight = 1)

map
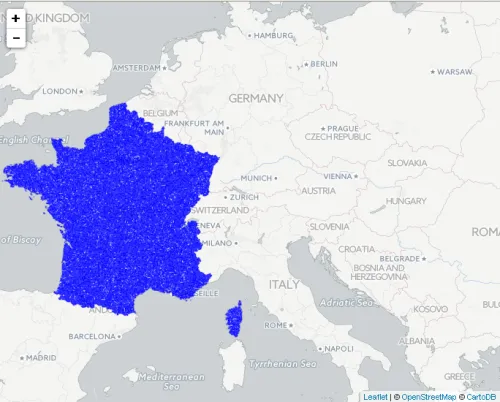
df <- raster::getData("GADM", country = "FRA", level = 4)?对我来说可以,只是想知道是你的数据还是某个包相关的问题。 - TimSalabim