使用fortify {ggplot2}将地图数据转换为数据框,用于R中的空间对象

5

我曾经可以毫无问题地运行这个脚本,但现在 fortify {ggplot2} 命令给了我一个错误信息。如果有任何提示可能会是什么问题,那就太好了!我使用 fortify 命令以便能够使用 ggplot2 进行 geom_map 形状文件。

下面是我的脚本和下载数据的链接。

#######################################################
#######################################################
rm(list = ls(all = TRUE))#clear workspace
getwd()
#upload packages
library(maps)
library(mapdata)
library(gridExtra)
library(rgdal)
library(rgeos)
library(ggplot2)
library(sp)
library(maptools)
gpclibPermit()

#setwd(".../FAO") FAO data are major fishing area divisions
> FAO<- readOGR(dsn="fao", layer="World_Fao_Zones")
OGR data source with driver: ESRI Shapefile 
Source: "fao", layer: "World_Fao_Zones"
with 19 features and 1 fields
Feature type: wkbPolygon with 2 dimensions
> names(FAO);dim(FAO)
[1] "zone"
[1] 19  1
> str(FAO,max.level=2)
Formal class 'SpatialPolygonsDataFrame' [package "sp"] with 5 slots
  ..@ data       :'data.frame': 19 obs. of  1 variable:
  ..@ polygons   :List of 19
  ..@ plotOrder  : int [1:19] 18 2 17 4 12 3 13 11 5 6 ...
  ..@ bbox       : num [1:2, 1:2] -180 -85.5 180 90
  .. ..- attr(*, "dimnames")=List of 2
  ..@ proj4string:Formal class 'CRS' [package "sp"] with 1 slots
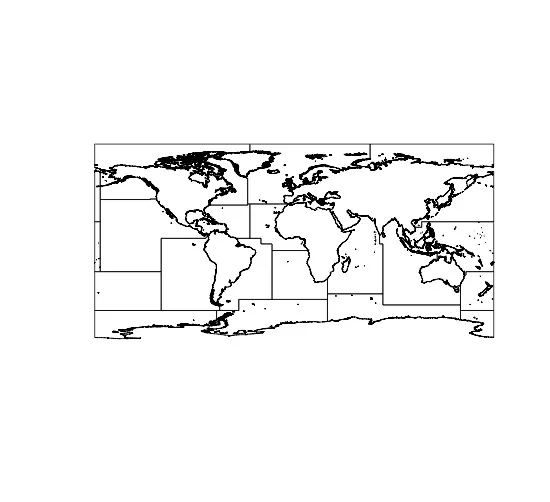
> plot(FAO)

FAO plot

FAO@data$id = rownames(FAO@data)
FAO.df <- as.data.frame(FAO)# convert shapefile to dataframe to merge later
> FAO_fort <- fortify(FAO, region="id")# fortify to plot with ggplot2 
Error in function (classes, fdef, mtable)  : 
  unable to find an inherited method for function "proj4string", for signature "NULL"

这是一个下载数据的链接FAO数据。 谢谢!

2个回答

9

我已经成功地在ggplot2中实现了它,以下是我使用的代码版本和会话信息。

在ggplot2中的地图

渔区

代码

rm(list = ls(all = TRUE)) #clear workspace

library(maptools)
library(gpclib)
library(ggplot2)

shape<-readShapeSpatial("./fao/World_Fao_Zones.shp") 
shape@data$id <- rownames(shape@data)
shape.fort <- fortify(shape, region='id') 
shape.fort<-shape.fort[order(shape.fort$order), ] 
ggplot(data=shape.fort, aes(long, lat, group=group)) + 
    geom_polygon(colour='black',
                 fill='white') +
    theme_bw()

会话

> sessionInfo()
R version 2.15.0 (2012-03-30)
Platform: x86_64-apple-darwin9.8.0/x86_64 (64-bit)

locale:
    [1] C/en_US.UTF-8/C/C/C/C

attached base packages:
    [1] grid      stats     graphics  grDevices utils    
[6] datasets  methods   base     

other attached packages:
    [1] mapproj_1.1-8.3 gpclib_1.5-1    maptools_0.8-14
[4] lattice_0.20-6  foreign_0.8-49  rgeos_0.2-5    
[7] stringr_0.6     sp_0.9-99       gridExtra_0.9  
[10] mapdata_2.2-1   ggplot2_0.9.0   maps_2.2-5     

loaded via a namespace (and not attached):
    [1] MASS_7.3-17        RColorBrewer_1.0-5 colorspace_1.1-1  
[4] dichromat_1.2-4    digest_0.5.2       memoise_0.1       
[7] munsell_0.3        plyr_1.7.1         proto_0.3-9.2     
[10] reshape2_1.2.1     scales_0.2.0       tools_2.15.0

非常感谢 @gauden,虽然我不太确定问题出在哪里,但是你的R代码确实帮助我解决了问题! - GodinA
@GodinA:很高兴这有所帮助 :) 在ggplot2的新版本中,使用
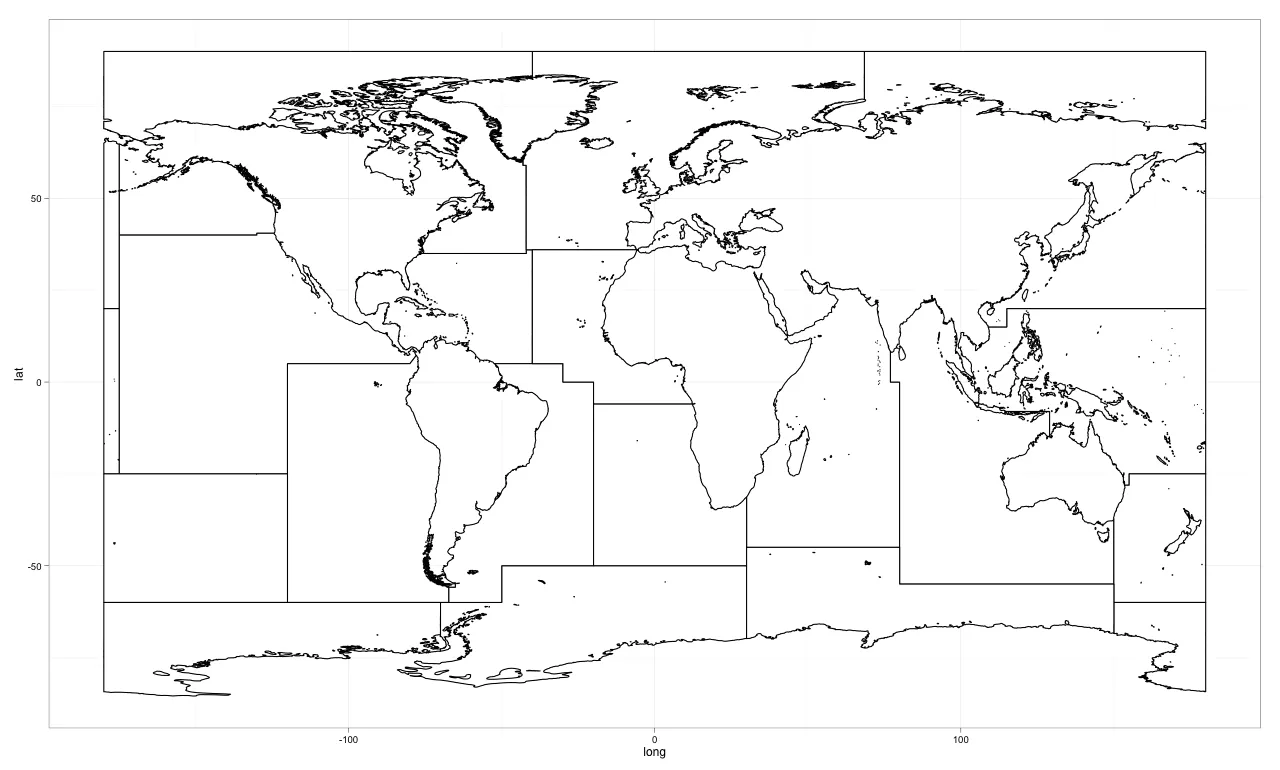
geom_map也可以实现同样的效果,你可能想进一步探索一下。 - daedalus

2
Fortify 很可能已经过时了。一种新的选择是 broom(请查看 此处 的文档)。它非常容易使用:
# Load shapefile
FAO <- readOGR(dsn="fao", layer="World_Fao_Zones")
#Convert
FAO_df <- tidy(FAO)

很遗憾,您上传的文件已经不存在了,因此我无法为您的示例演示该命令。

网页内容由stack overflow 提供, 点击上面的
可以查看英文原文,
原文链接