我找不到一种方法来根据数值改变Excel数据条的颜色。当前的格式选项只允许基于正/负数值使用不同的颜色。我当前使用的是Excel 2010。
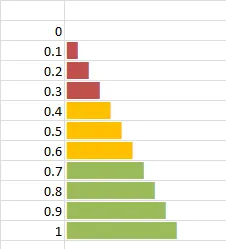
我想让数据条的颜色在数值在0-0.3之间时显示为“红色”,在0.3-0.6之间时显示为“黄色”,在>0.6之间时显示为“绿色”。
如果有任何信息可以分享,我会非常感激。
谢谢,
TB
我找不到一种方法来根据数值改变Excel数据条的颜色。当前的格式选项只允许基于正/负数值使用不同的颜色。我当前使用的是Excel 2010。
我想让数据条的颜色在数值在0-0.3之间时显示为“红色”,在0.3-0.6之间时显示为“黄色”,在>0.6之间时显示为“绿色”。
如果有任何信息可以分享,我会非常感激。
谢谢,
TB
Data bars只支持每组数据一个颜色。这样做的想法是,数据条的长度可以向您指示高、中或低。
可以使用颜色刻度来实现条件颜色。
您所描述的听起来像两者的结合,但在Excel中不存在,我也看不到简单的方法来hack它。
您可以使用一种称为“单元格内图表”的方式,在火花线出现之前很受欢迎。使用公式重复字符(在截图中是使用Marlett字体格式化的字符g),然后使用条件格式更改字体颜色。
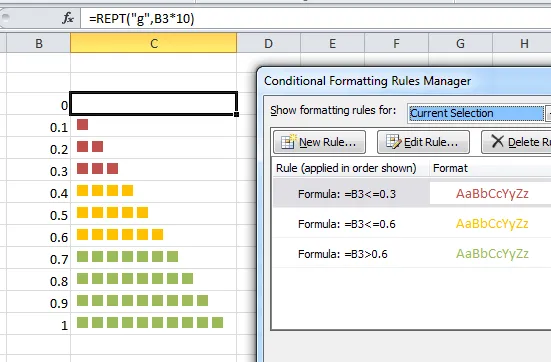
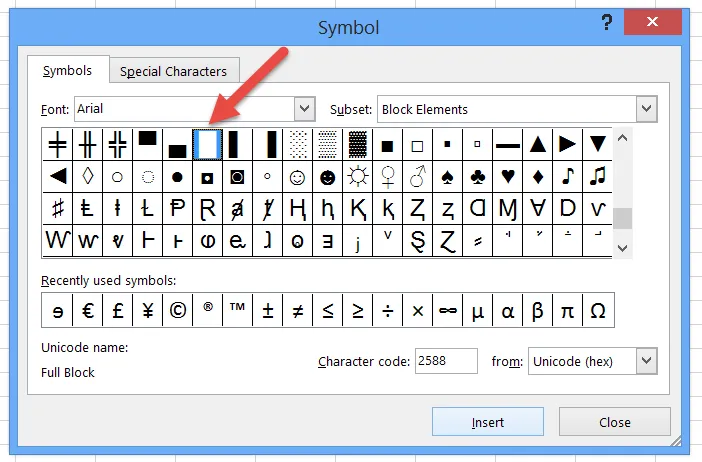
为了获得更好的“条形”感觉,请使用带有常规字体的Unicode字符2588。
编辑:并非每个Unicode字符都在每个字体中都有表示。在这种情况下,Unicode 2588在Arial字体中显示正常,但在Excel的默认Calibri字体中不能正确显示。选择适当的字体。插入>符号对话框将有助于找到合适的字符。
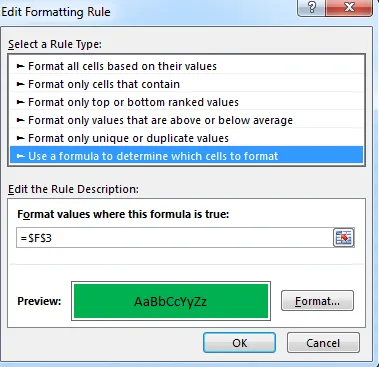
我在数据条旁边的单元格中设置了条件格式,根据目标单元格中的值更改颜色(绿色、黄色、红色、橙色)。然后,我通过下面的VBA循环来根据相邻单元格中的条件格式更新数据条颜色。
Dim intCount As Integer
Dim db As DataBar

On Error Resume Next
For intCount = 9 To 43 'rows with data bars to be updated
    Worksheets("Worksheet Name").Cells(intCount, 10).FormatConditions(1).BarColor.Color = Worksheets("Worksheet Name").Cells(intCount, 11).DisplayFormat.Interior.Color
Next intCount
不必为一系列单元格创建条件格式,我使用基于VBA的下面两个子程序逐个对每个单元格进行有条件地格式化。结果在代码下面的链接中显示。希望这可以帮到你。
' The purpose of this sub is to add a data bar to an individual cell
' The value in the cell is expected to be decimal numbers between -1 and 1
' If the value is greater than or equal to -0.1 and less than or equal to 0.1, then display green bars
' If the value is less than -0.1 and greater than -.2, OR greater than 0.1 and less than 0.2 then yellow bars
' All other scenarios display red bars
Sub Add_Data_Bar(rngCell As Range, dblValue As Double)

' Clears existing conditional formatting from the cell
' Adds a new data bar to the cell
With rngCell.FormatConditions
    .Delete
    .AddDatabar
End With

    ' Creates a databar object for the databar that has been added to the cell
    Dim dbar As Databar
    Set dbar = rngCell.FormatConditions(rngCell.FormatConditions.Count)

        ' Sets the databar fill type to display as gradient
        dbar.BarFillType = xlDataBarFillGradient

        ' Sets the databar border style
        dbar.BarBorder.Type = xlDataBarBorderSolid

        ' Sets the databar axis position
        dbar.AxisPosition = xlDataBarAxisMidpoint

        ' Sets the minimum limit of the data bar to -1
        With dbar.MinPoint
            .Modify newtype:=xlConditionValueNumber, newvalue:=-1
        End With

        ' Sets the maximum limit of the data bar to +1
        With dbar.MaxPoint
            .Modify newtype:=xlConditionValueNumber, newvalue:=1
        End With

            ' Sets the color based on what value has been passed to the sub
            ' Green
            If dblValue <= 0.1 And dblValue >= -0.1 Then

                With dbar
                    .BarColor.Color = RGB(99, 195, 132) ' Green
                    .BarBorder.Color.Color = RGB(99, 195, 132)
                End With

            ' Yellow
            ElseIf (dblValue > 0.1 And dblValue <= 0.2) Or (dblValue < -0.1 And dblValue >= -0.2) Then

                With dbar
                    .BarColor.Color = RGB(255, 182, 40) ' Yellow
                    .BarBorder.Color.Color = RGB(255, 182, 40)
                End With

            ' Red
            Else

                With dbar
                    .BarColor.Color = RGB(255, 0, 0) ' Red
                    .BarBorder.Color.Color = RGB(255, 0, 0)
                End With

            End If

End Sub


' Applies the databar formatting to each cell in a range
‘ Call this on the Worksheet_Change event so that the formatting updates when data is refreshed
Sub Loop_Through_Range()

' Range to be looped through
Dim rng As Range
Set rng = Sheet1.Range("A2:A22")

' Range for For Loop
Dim cell As Range

    ' Loops through each cell in your range
    For Each cell In rng.Cells
        Call Add_Data_Bar(cell, cell.Value)
    Next

End Sub